jason's hyperion blog

essbase from the trenches

Essterm: Terminal-based ad hoc client for Essbase

Remember the last time you thought, “You know, Excel is just a little too modern, I wish I could do multi-dimensional analysis using my keyboard, in a terminal, the way the Pilgrims did it.”

Me neither.

Yet, here we are.

I was going to originally throw this over the fence release this as a bit of an April Fool’s joke, but I didn’t have quite enough time. I actually showed this off to the fine folks at my Collaborate session last month, and believe it or not, some of the people there thought it had some interesting use-cases.

Why Essterm?

As part of my research for a different project, I came across a Java library called Lanterna. Lanterna allows for implementing interfaces in a terminal. It’s like Java’s Swing (GUI) library, but for text. One of the interesting use cases for this is that you can SSH into a Linux server from Linux/Windows/macOS/whatever and run it through the terminal. So I started playing around with the widgets that are available in the library – text input areas, labels, buttons, list boxes, tables, dialogs, and so on, wiring it up to Essbase, and well, here we are:

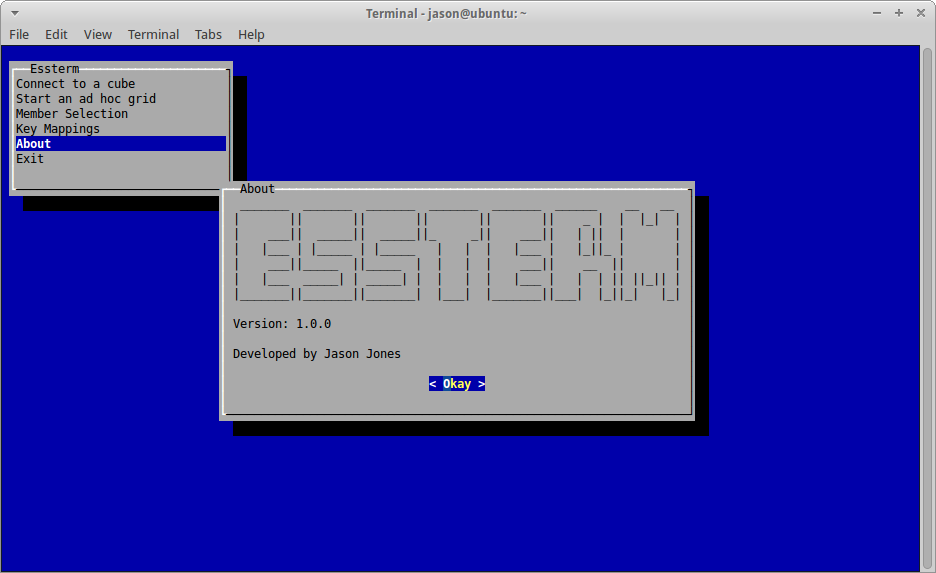
I’ve been pretty happy with the text-based GUI capabilities of the Lanterna library, including my ability to wire up a GUI for such things as a little About dialog:

The Essterm About dialog

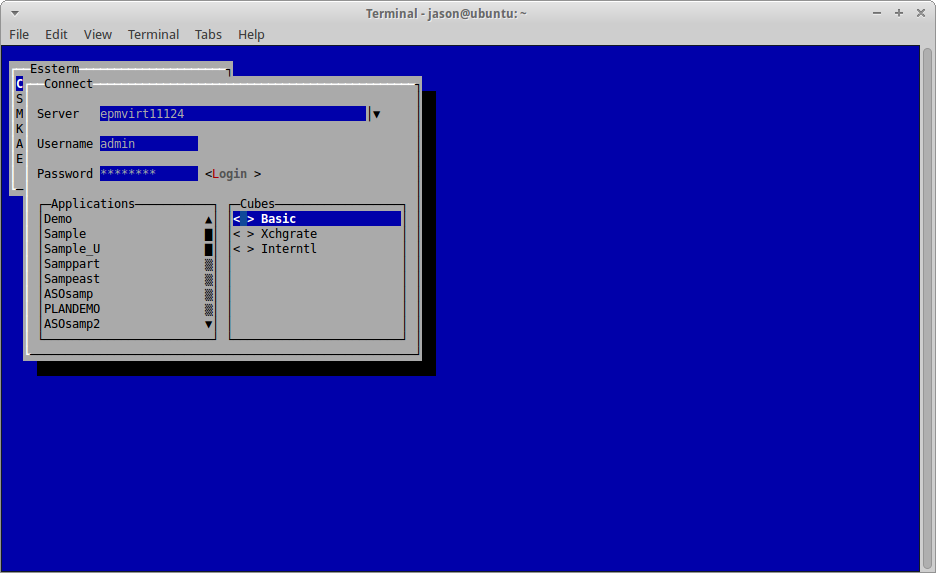
Connecting to a server/application/cube:

Selecting an Applicatin/Cube in Essterm

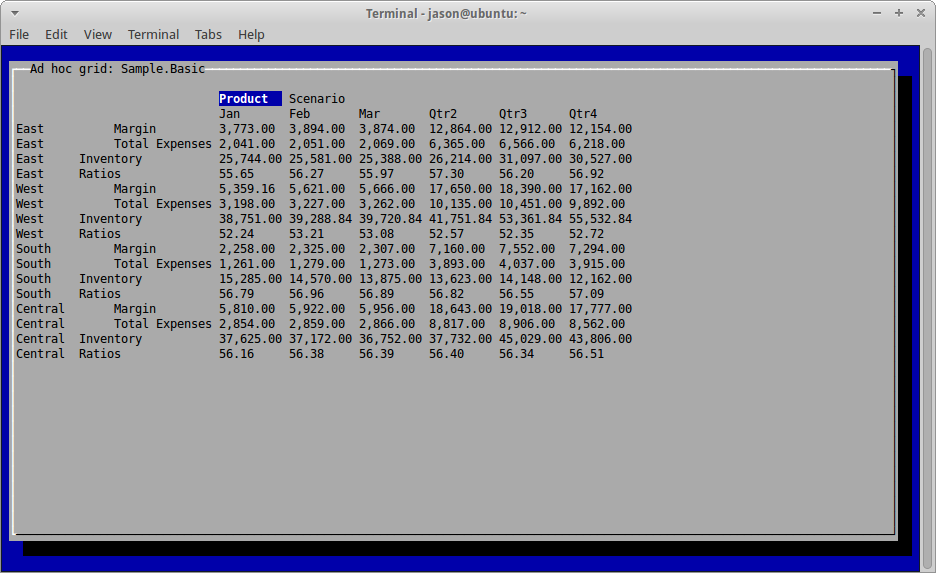
Performing ad hoc operations:

Ad hoc on Sample/Basic with Essterm

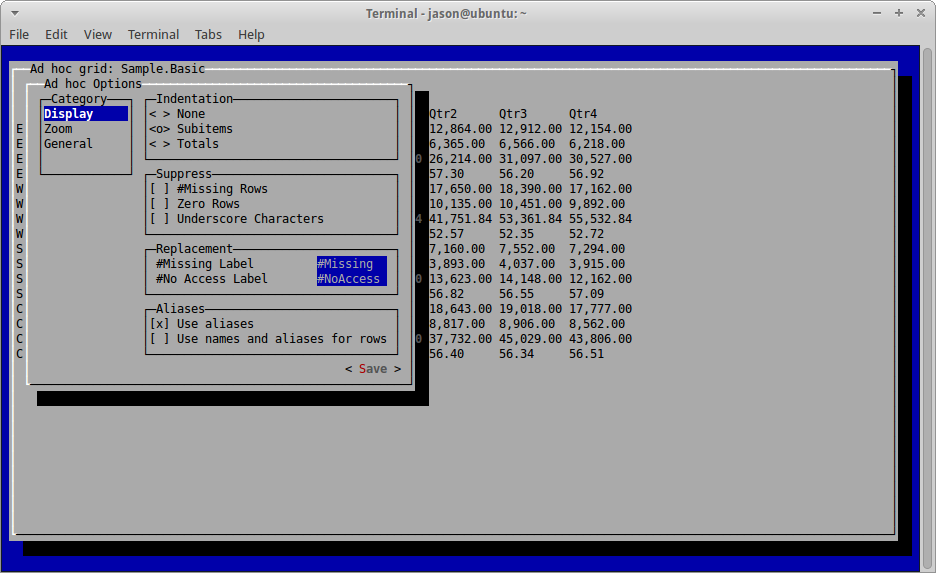
And building an options dialog:

Ad hoc options management in Essterm

As you can see in the short video, Essterm is packaged as un “uber-jar” that is runnable. This has been my preferred way to distribute Java applications lately since it lets you get away from boring class path issues and batch/shell files that have to try and invoke Java in just the right way. I really like being able to just run a JAR file and not have to worry about anything else.

Next Steps

As with many other things I work on, Essterm is a bit of a side project. And the business of Making Essbase Even Better in an official capacity comes first. But if you are interested in playing with Essterm, please feel free to contact me for the proper files. I’d be curious for your feedback. I am thinking sometime later this year I will just release it as an open-source project for anyone at all that wants to use it or make something with it.

Next Generation Outline Extractor version 2.1.3: Relational extraction enhancements

We’ve made some enhancements to the Next Generation Outline Extractor to incorporate user feedback and requests. The main improvement to this newest release, version 2.1.3, is with the way that relational database extractions are handled. More specifically, the storing of relational credentials has been improved so that they are no longer stored in cleartext. This will lead to improved security for organizations using this functionality in their automation. Additionally, the configuration for relational extractions has been simplified a bit. There is now no longer a need to edit the persistence.xml file, rather, everything is stored in the main properties file.

As part of this  post, I want to go over how the new functionality works, including a full “soup to nuts” use case. I think a lot of people use the outline extractor for “one-off” extractions, although a lot of people might be unaware that it can just as easily be used to quite easily automate extractions.

So, let’s dive in. I’m going to be using an internal build (i.e., running the extractor directly from my Java IDE), which is why the version is listed as “internal”. Also, I’m running on a Mac, where the UI looks a little different. The main difference is with the rendering of the tabs. On Windows the tabs for the UI are on the left side. However, on a Mac this is curiously rendered on the left side but the tabs are not rotated. So don’t be alarmed by the funky UI – it works fine and looks “normal” on Windows.

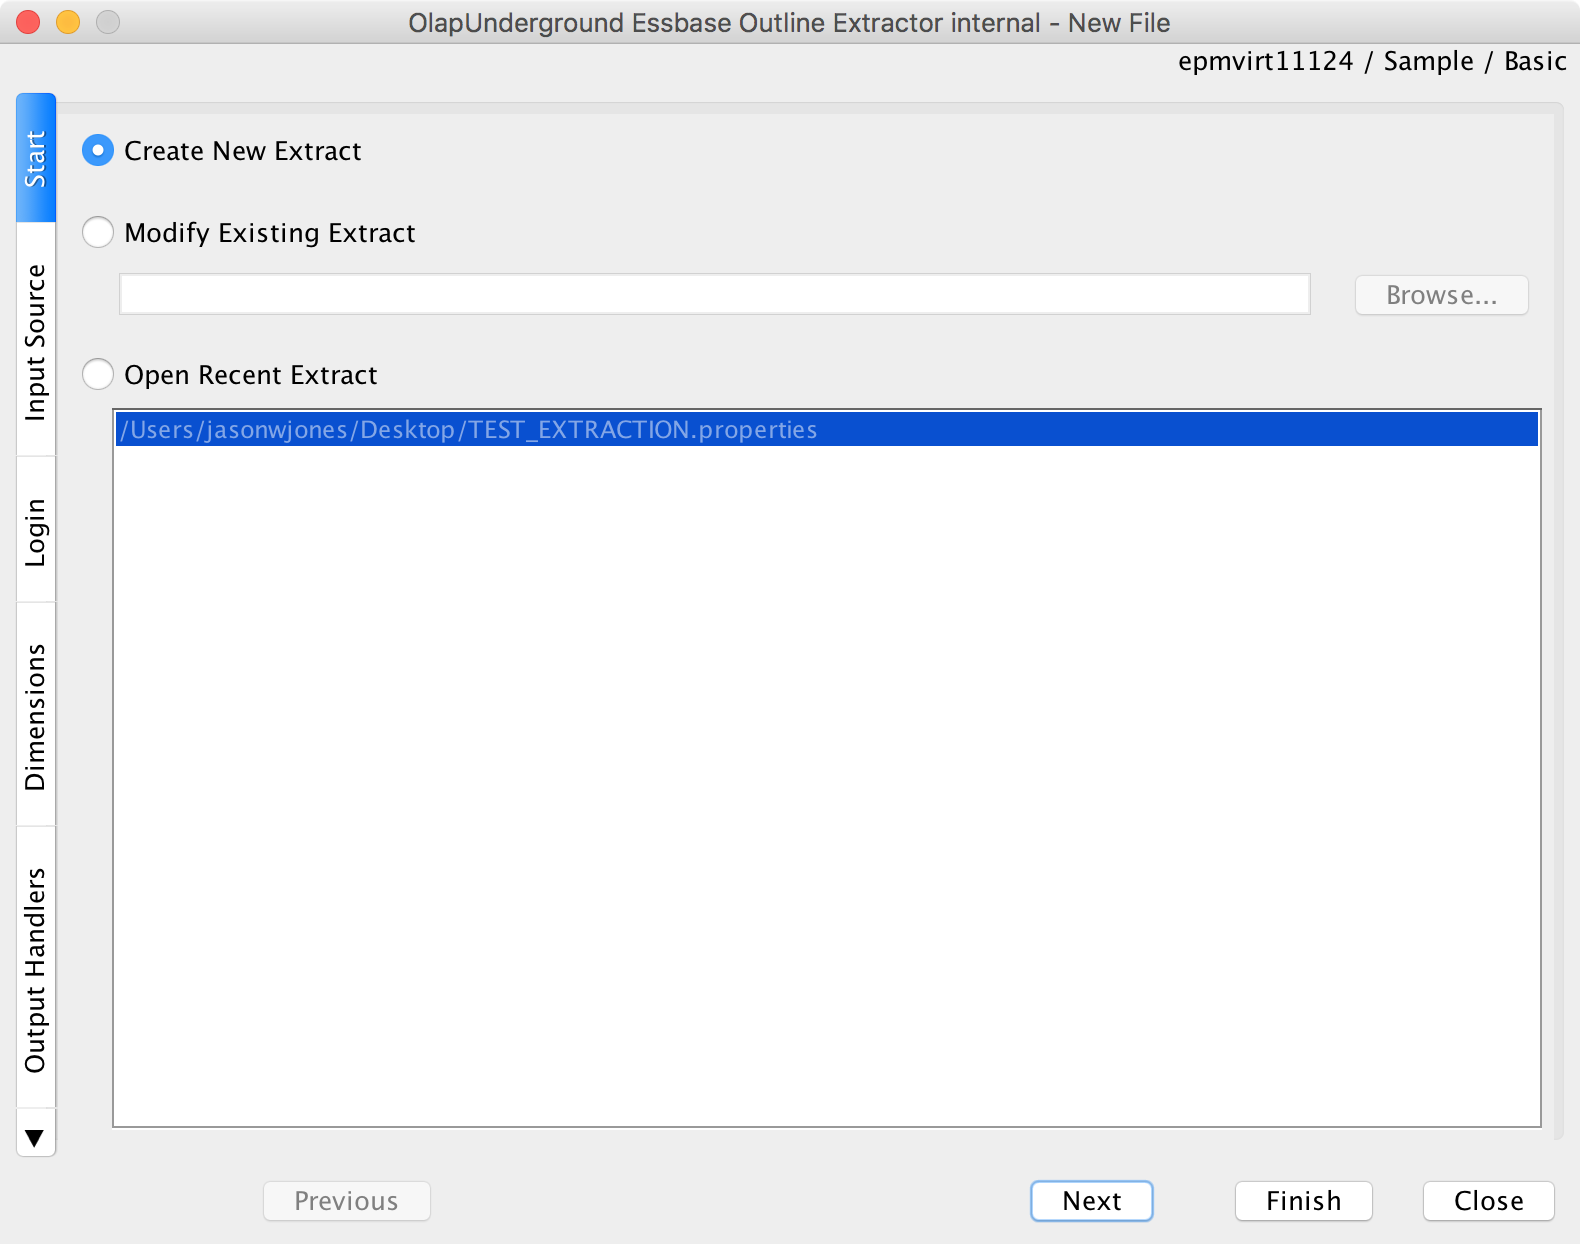
First, we launch the extractor’s UI. We’re going to create a new extraction definition:

Creating a new Essbase Extraction

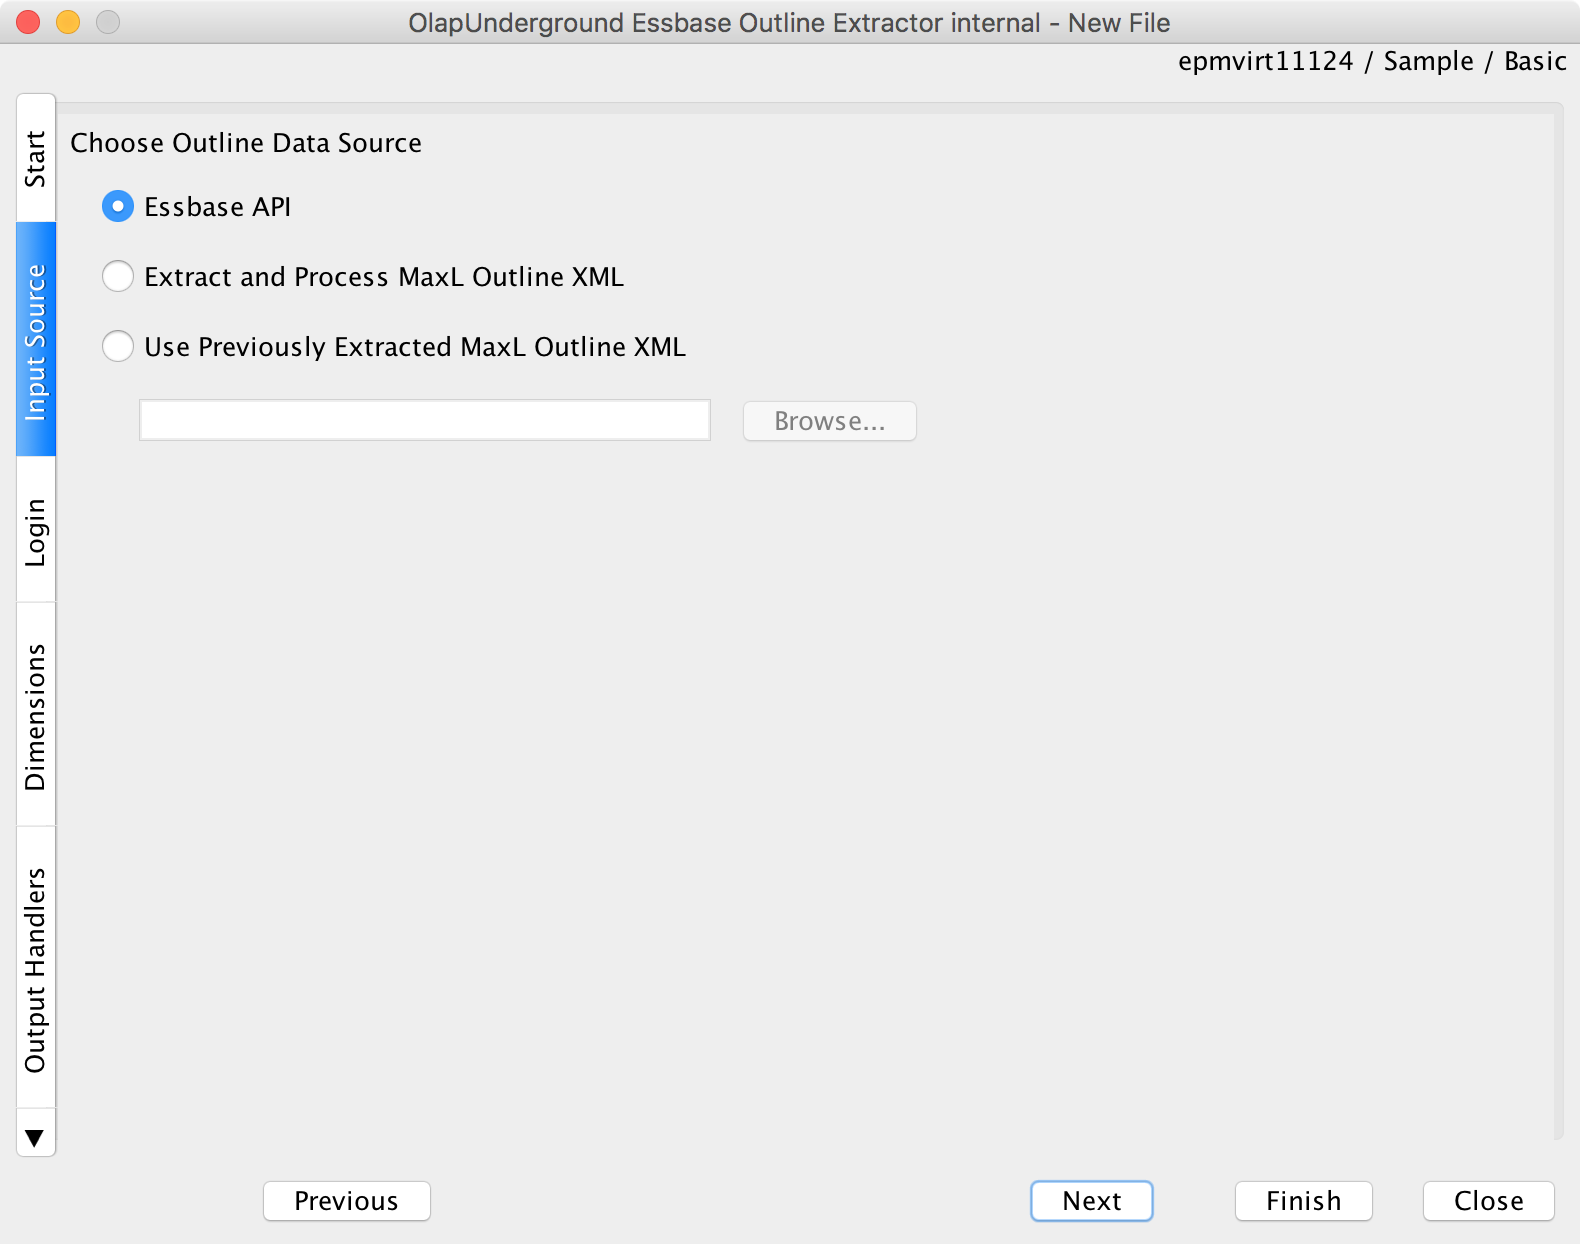
Next, we’ll choose the source of the outline data. For this I’m just going to use the Essbase API. Note that the “MaxL” extraction can be much, much faster, assuming your version of Essbase supports it.

We’ll extract using the Essbase API (note: MaxL can be much faster)

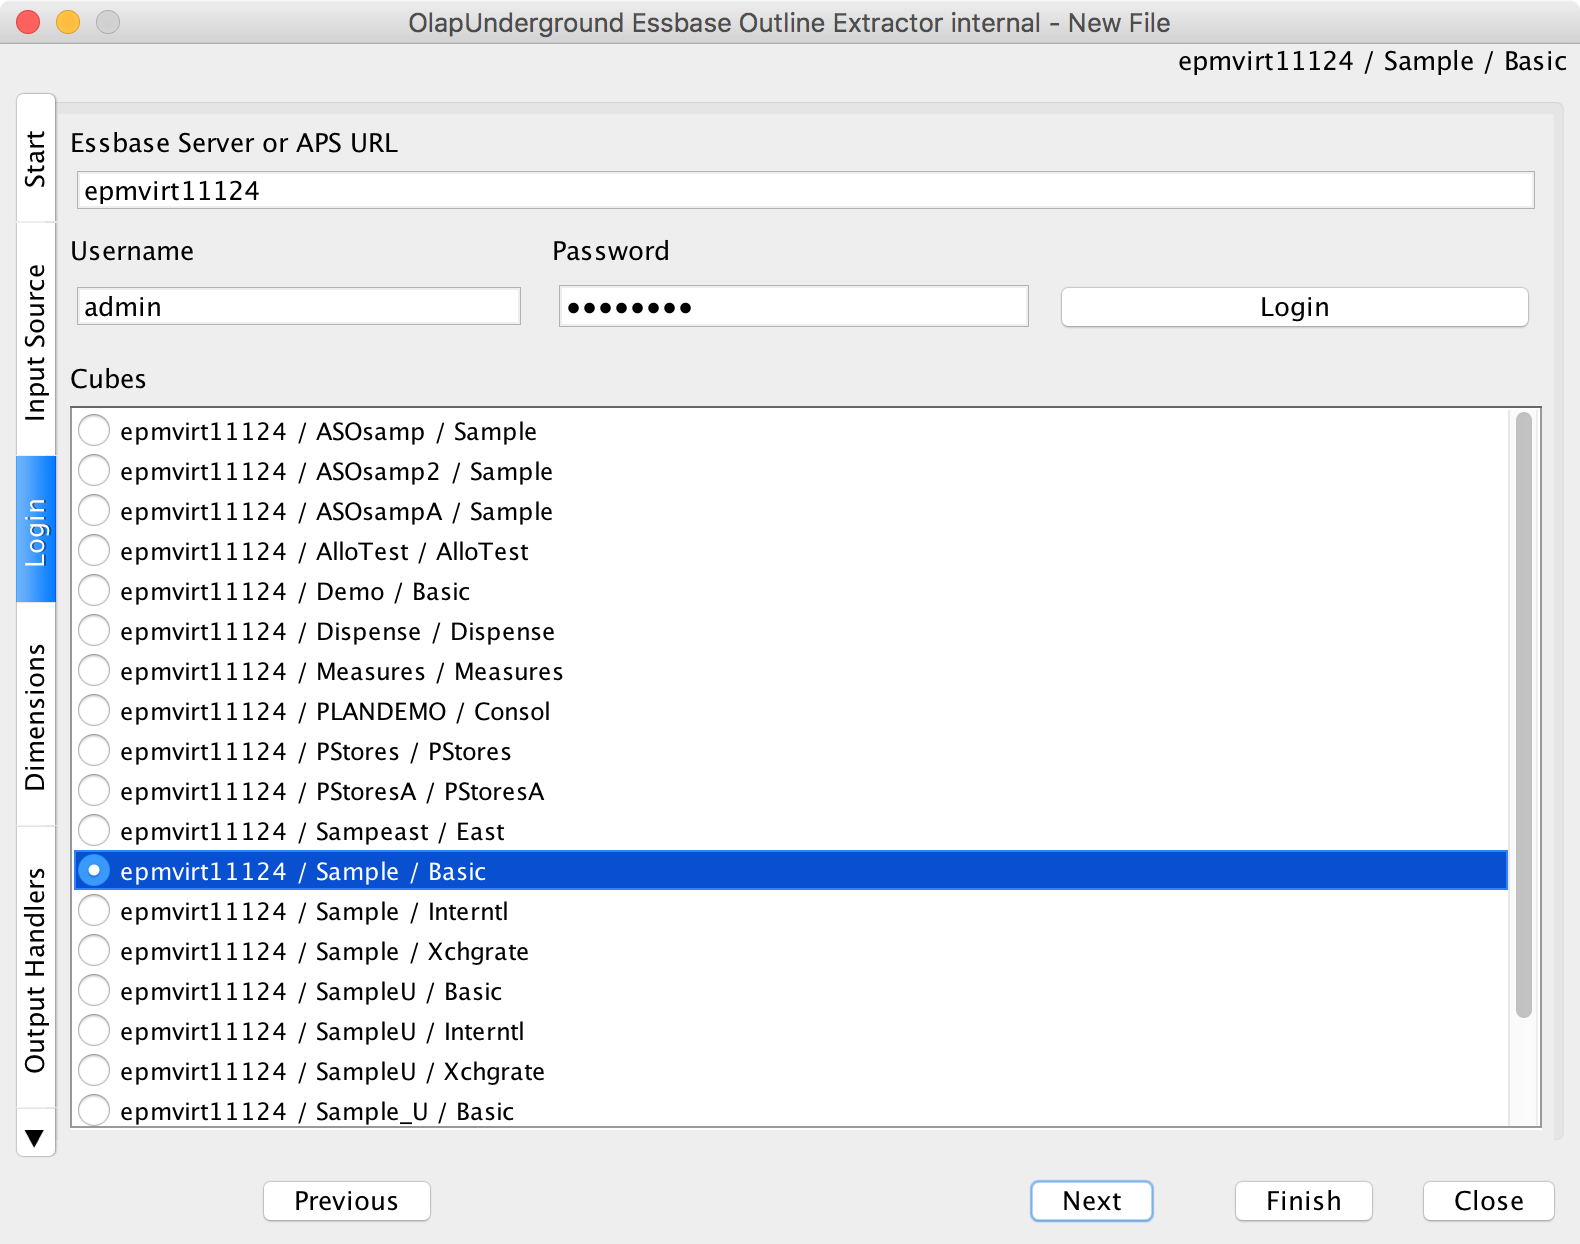
We’ll login to an Essbase server and choose a cube:

Choose an Essbase server/cube

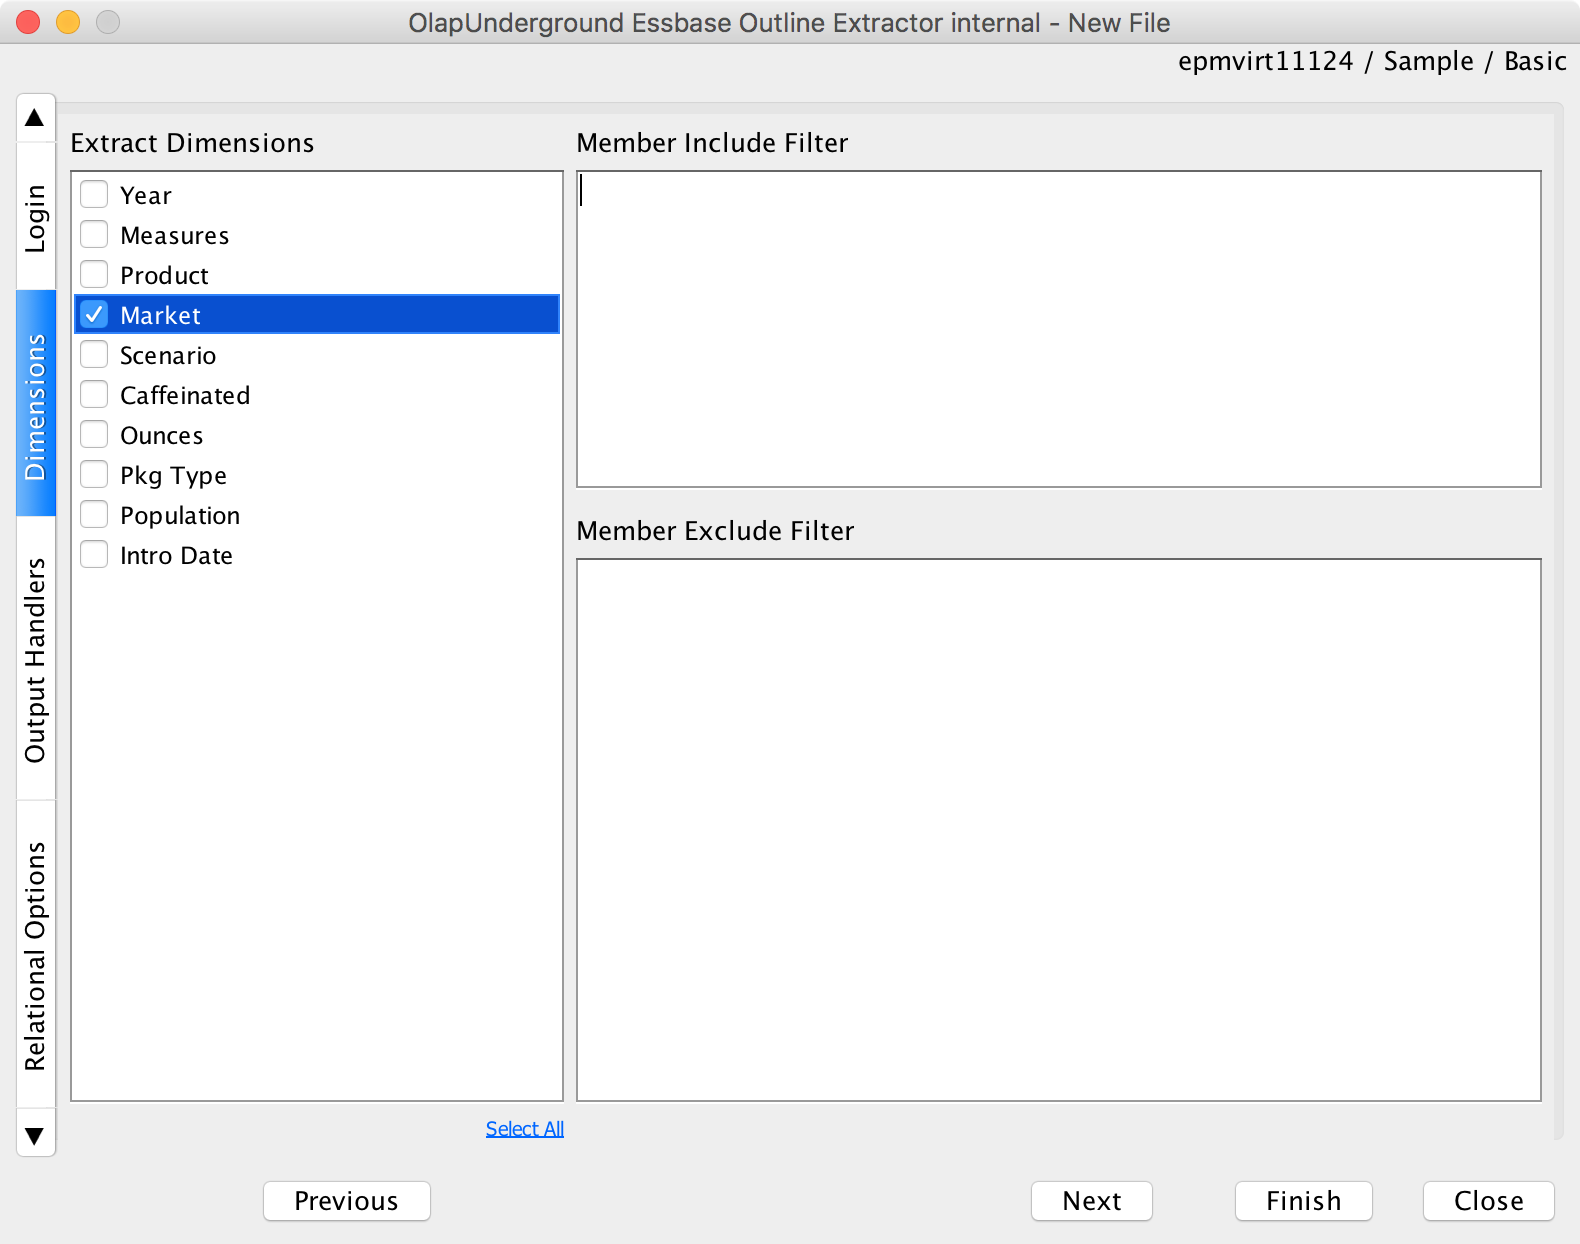
Then choose any/all dimensions to extract:

Choose one or more dimensions

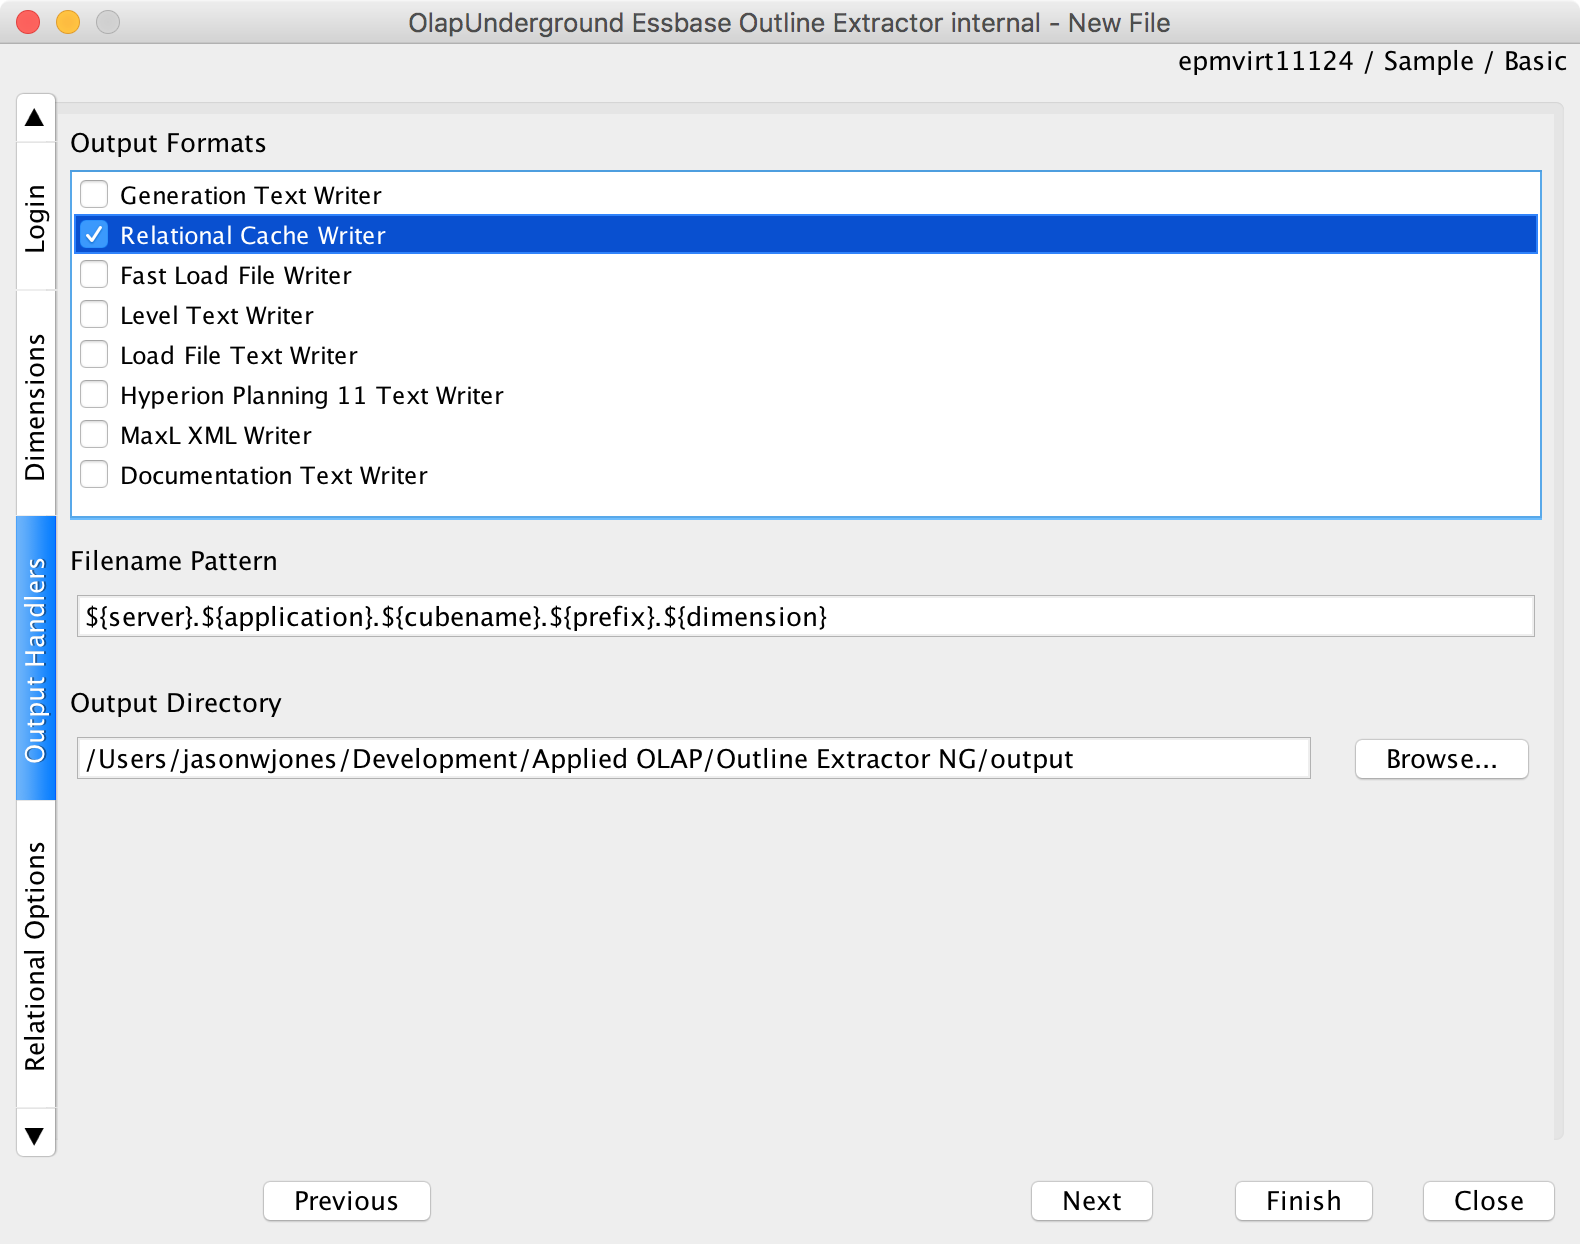
Now we can choose our extractor(s). As this post is focused on the relational extraction, I’ll just choose the Relational Cache Writer only:

Pick the relational cache writer

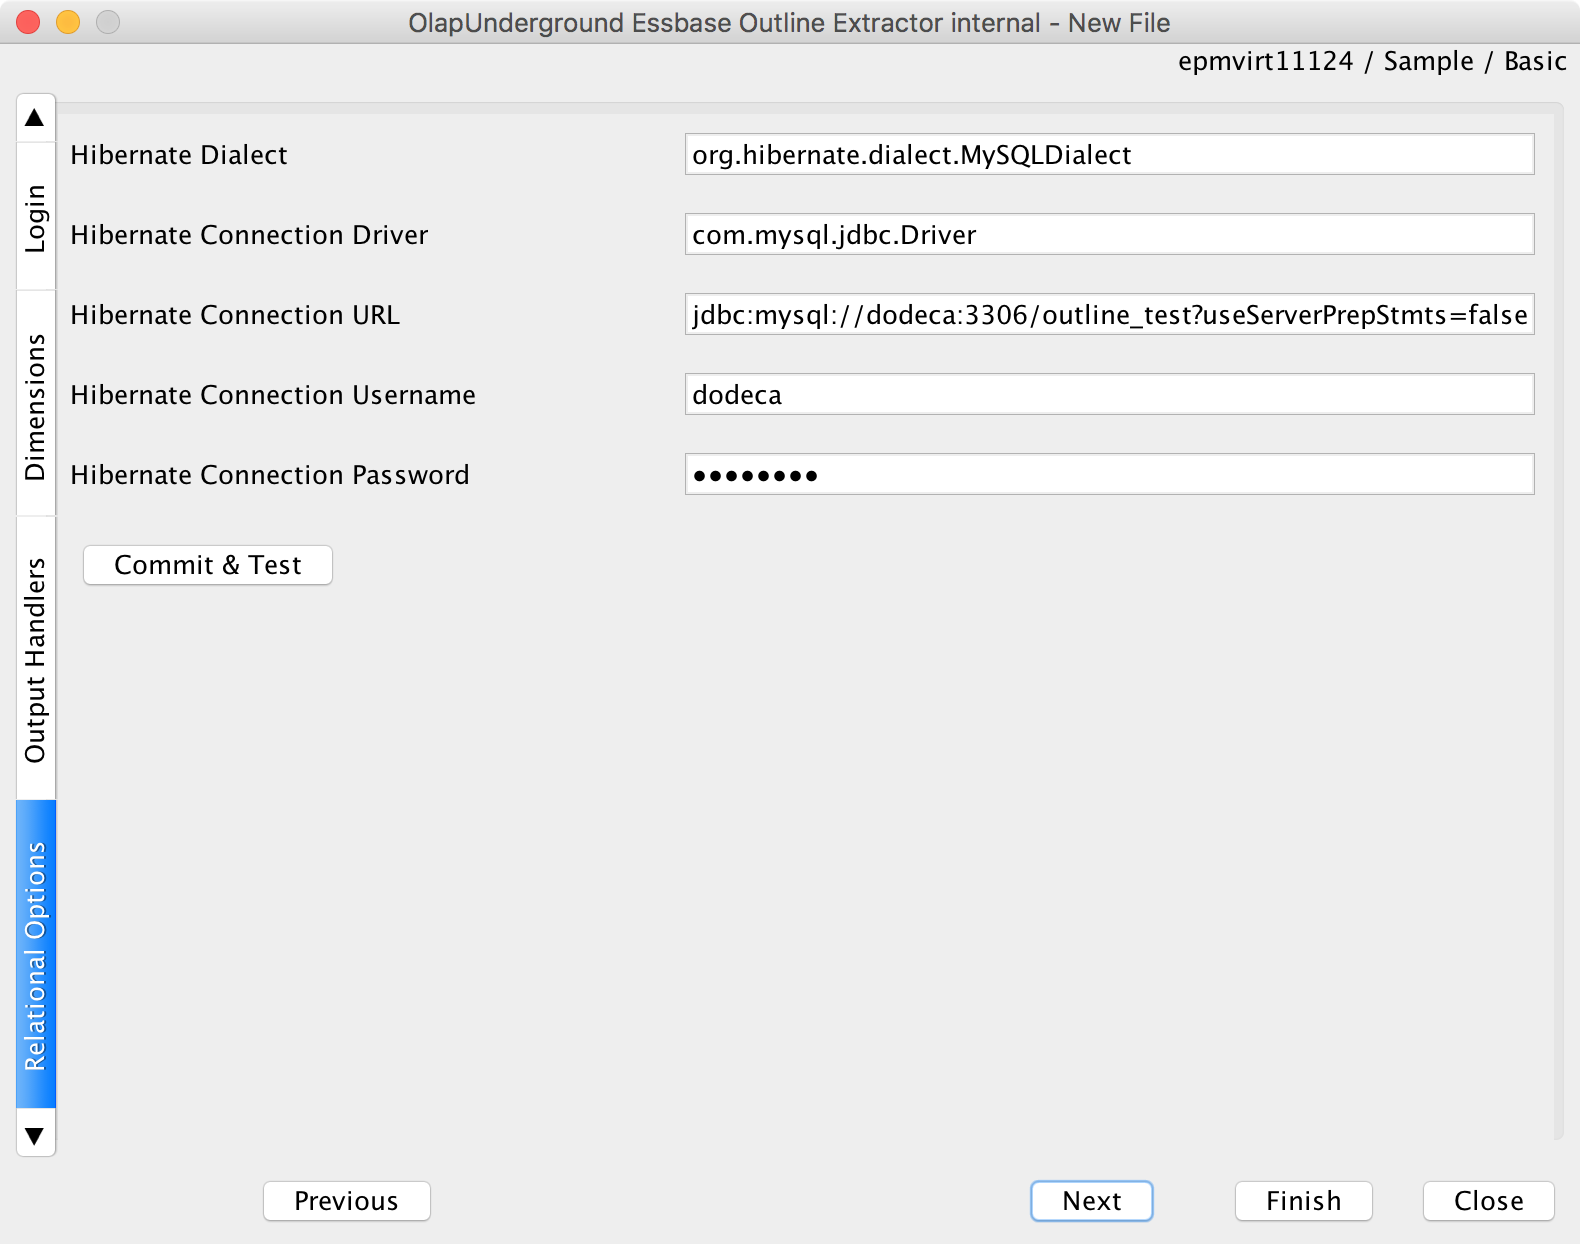
Now we need to define the relational configuration. You’ll notice that this is referred to as the “Hibernate” properties. Hibernate is a very widely used Java library that helps map from object oriented programming paradigms to a relational database. We need specify the dialect (there are different dialects for each database type, such as SQL Server, MySQL, Oracle, and others), the driver class, the JDBC URL, and the credentials. Note that each type of database has it’s own JDBC URL syntax and driver. If you need help with your database type, you can typically just google for JDBC plus your database type to get the proper settings.

Configure relational settings

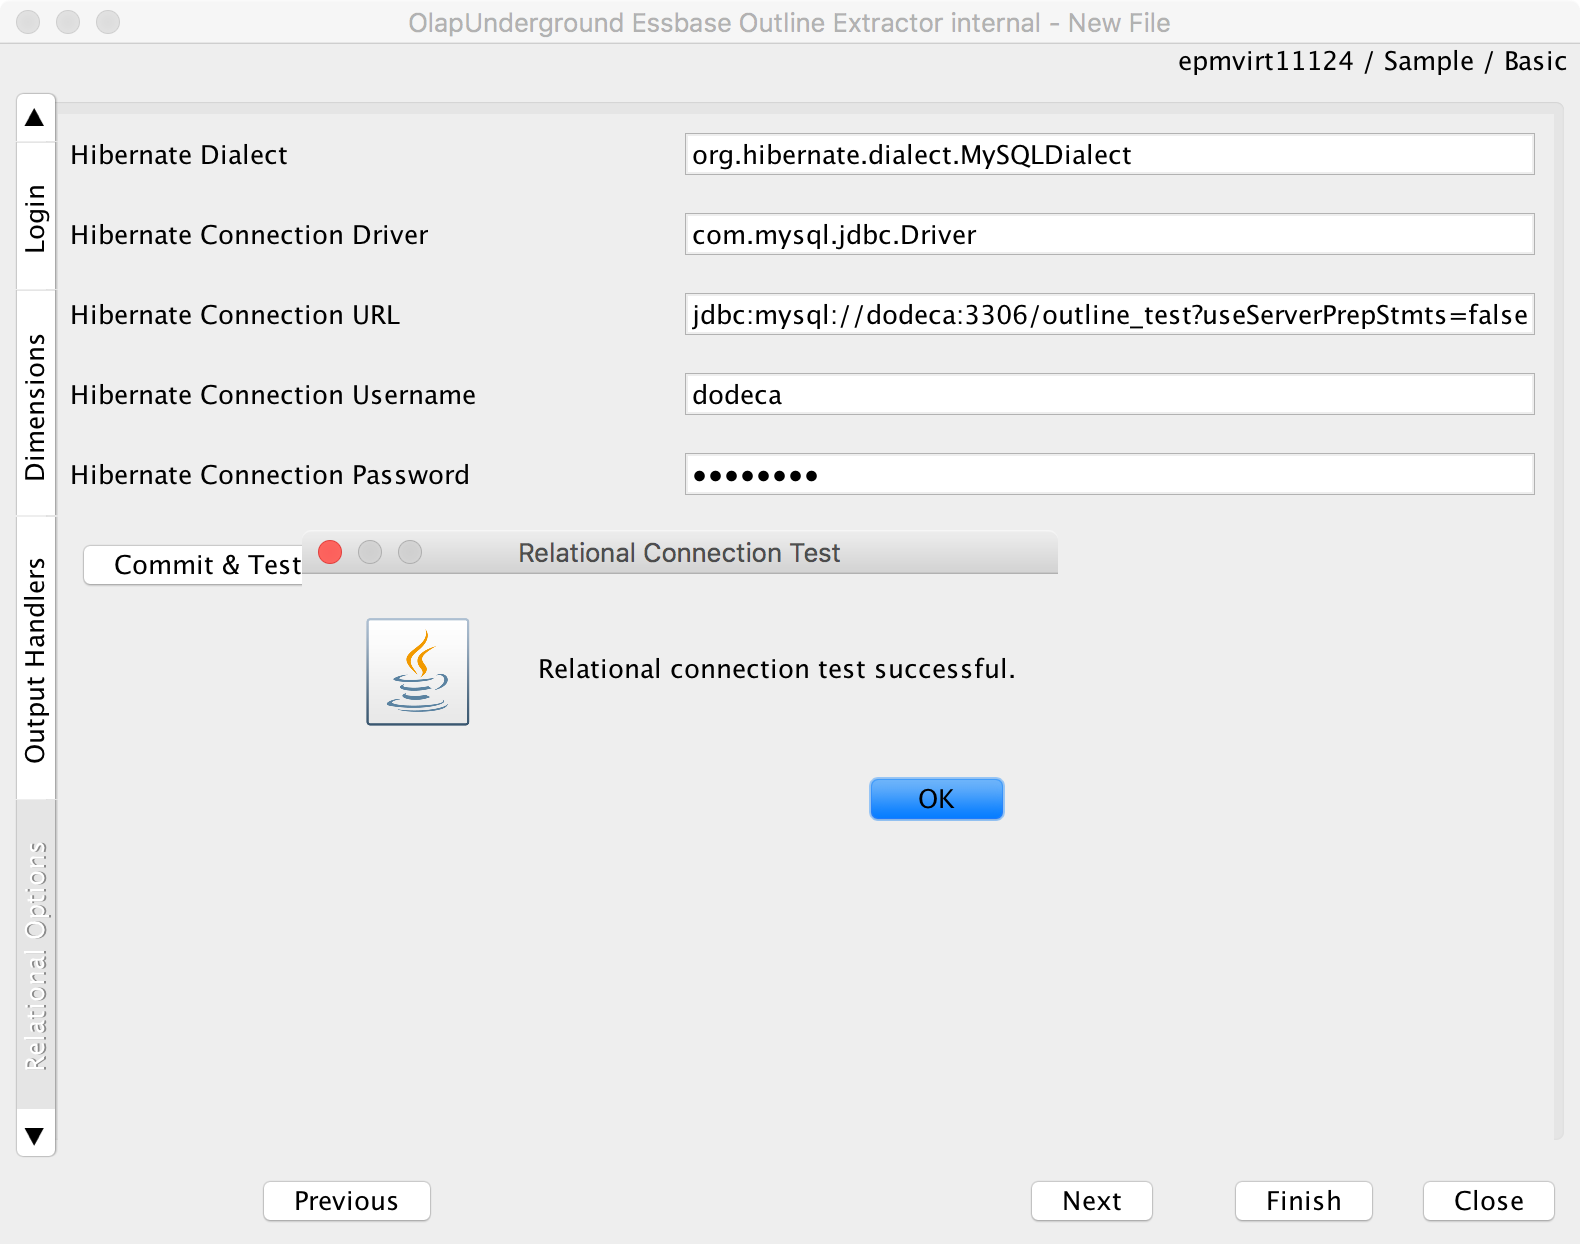
Next we’ll want to press Commit & Test so we can verify we have the database connection information correct. This will actually create the tables on the target schema that will be used to store the member information. You can see here that the test was successful:

Results of a Commit & Test if successful

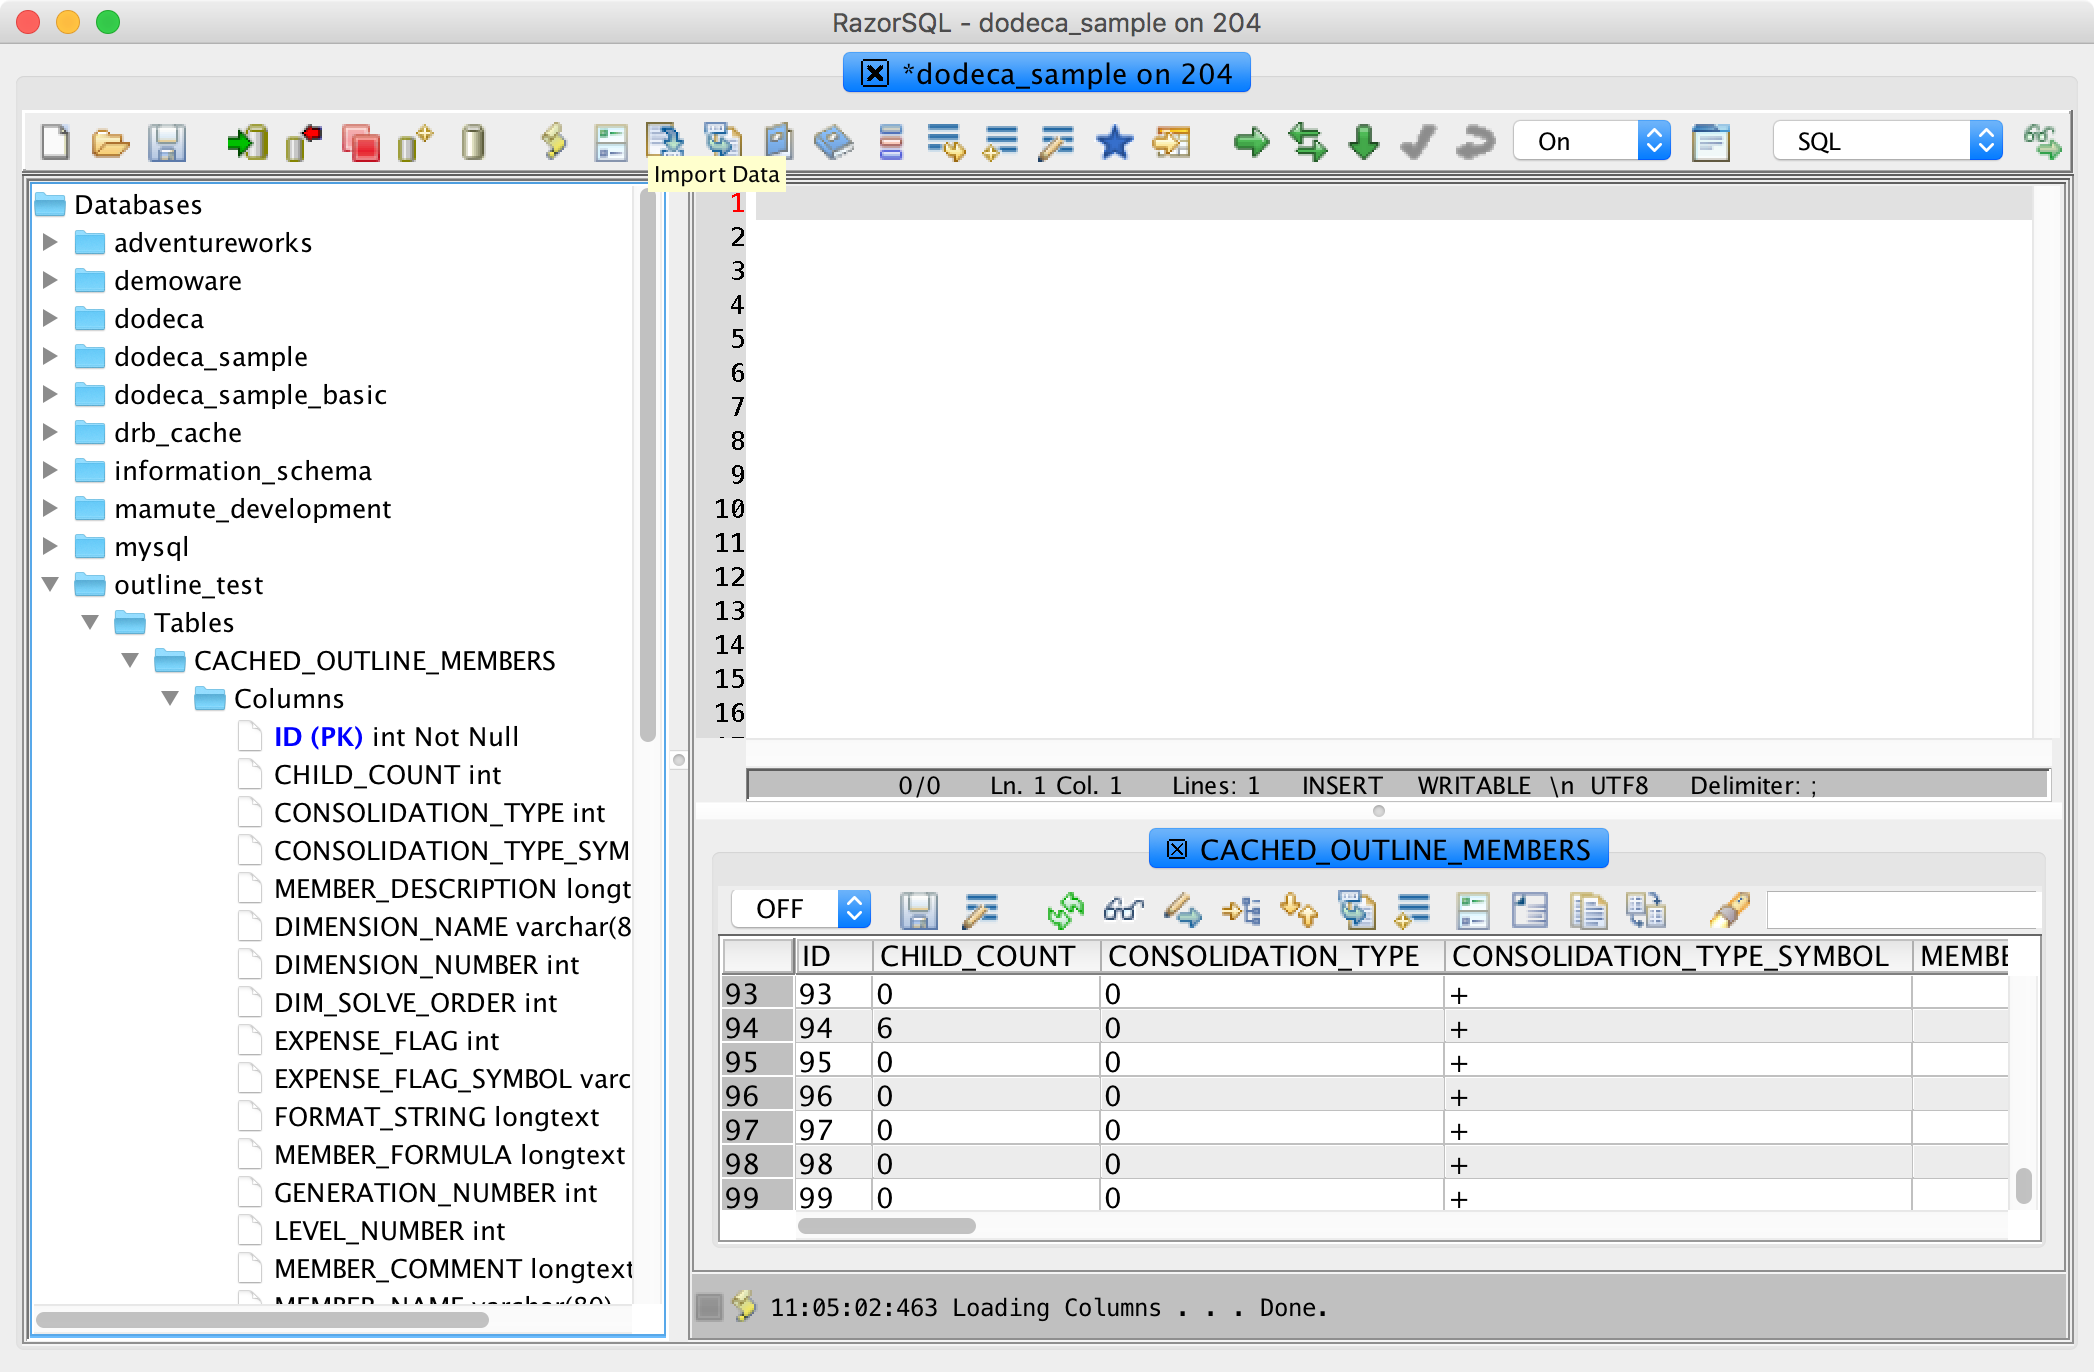
Switching over for a minute to my JDBC tool (RazorSQL), I can connect to my database server and see that indeed, the tables are created properly in the target schema:

Checking the tables in a JDBC tool

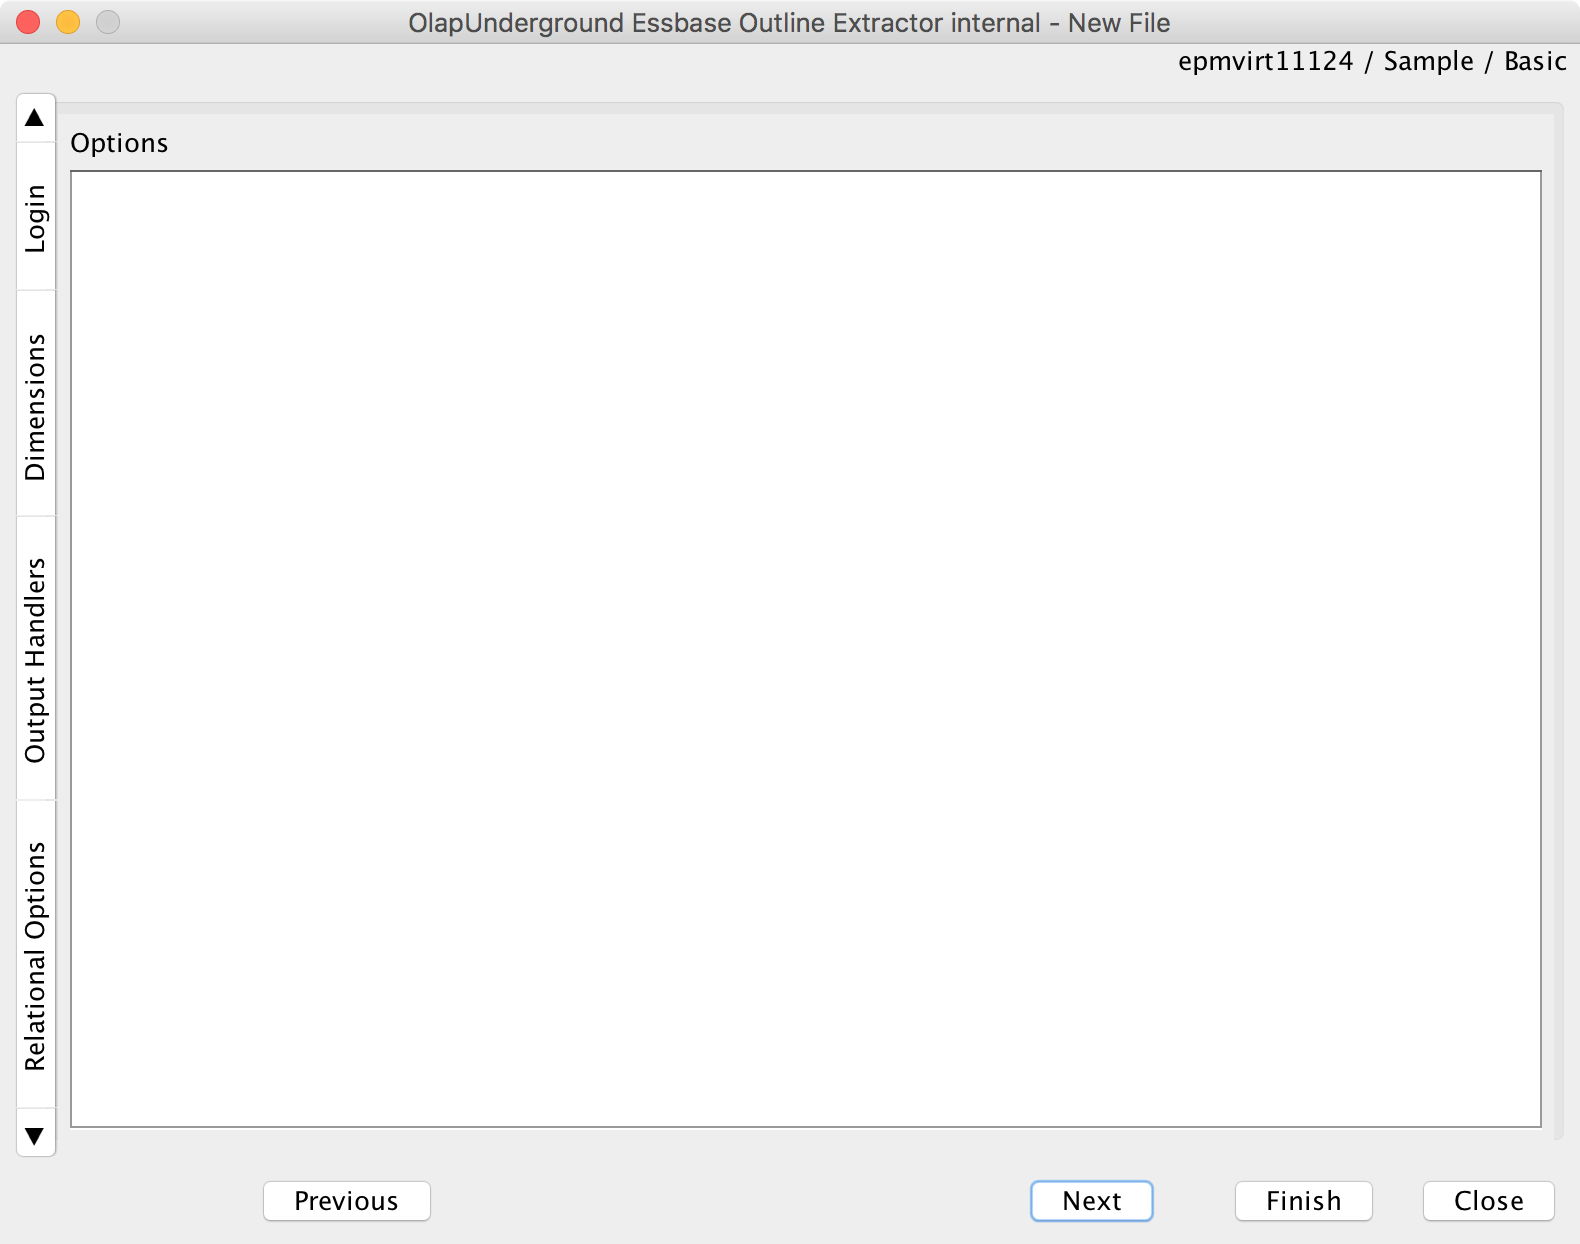
Back in the outline extractor, I can move forward to the options tab (there are no options for the relational extractor, so we can just skip ahead here):

No options to configure on this writer type

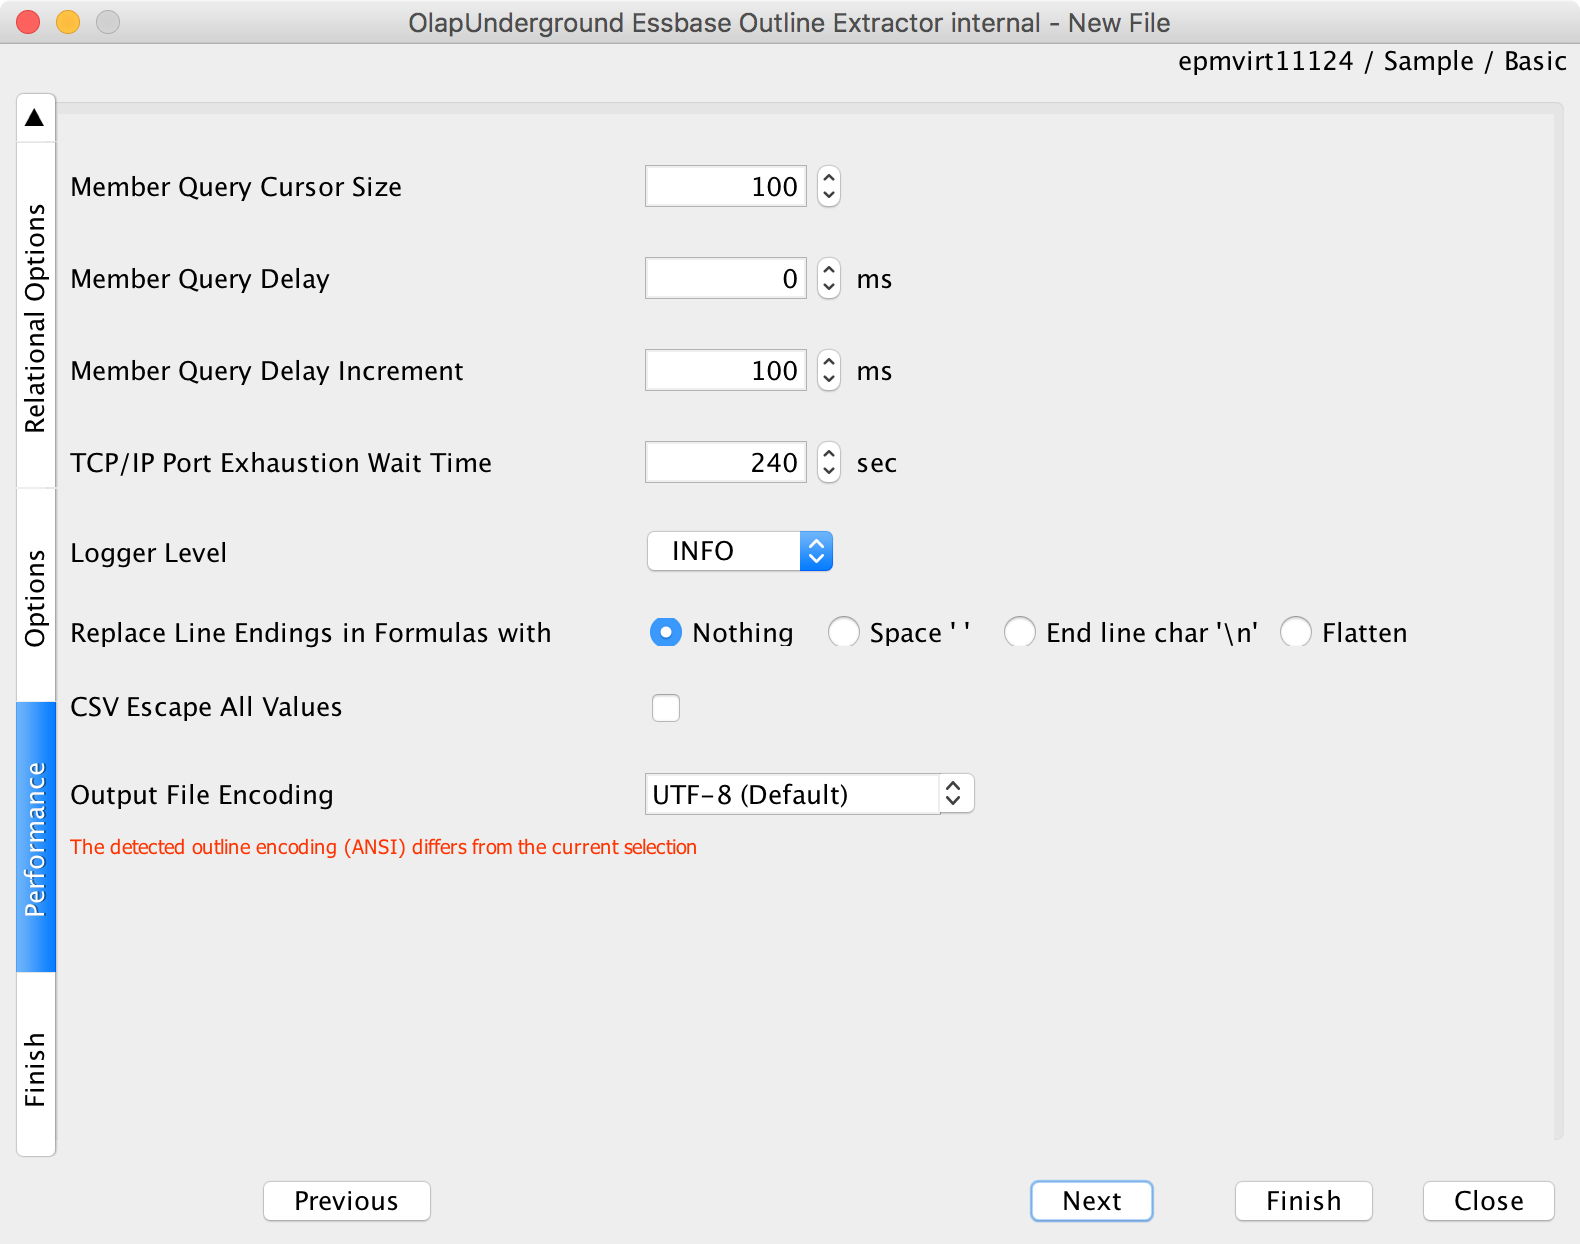
We can just accept all the defaults here on the Performance settings:

General extraction options (all default)

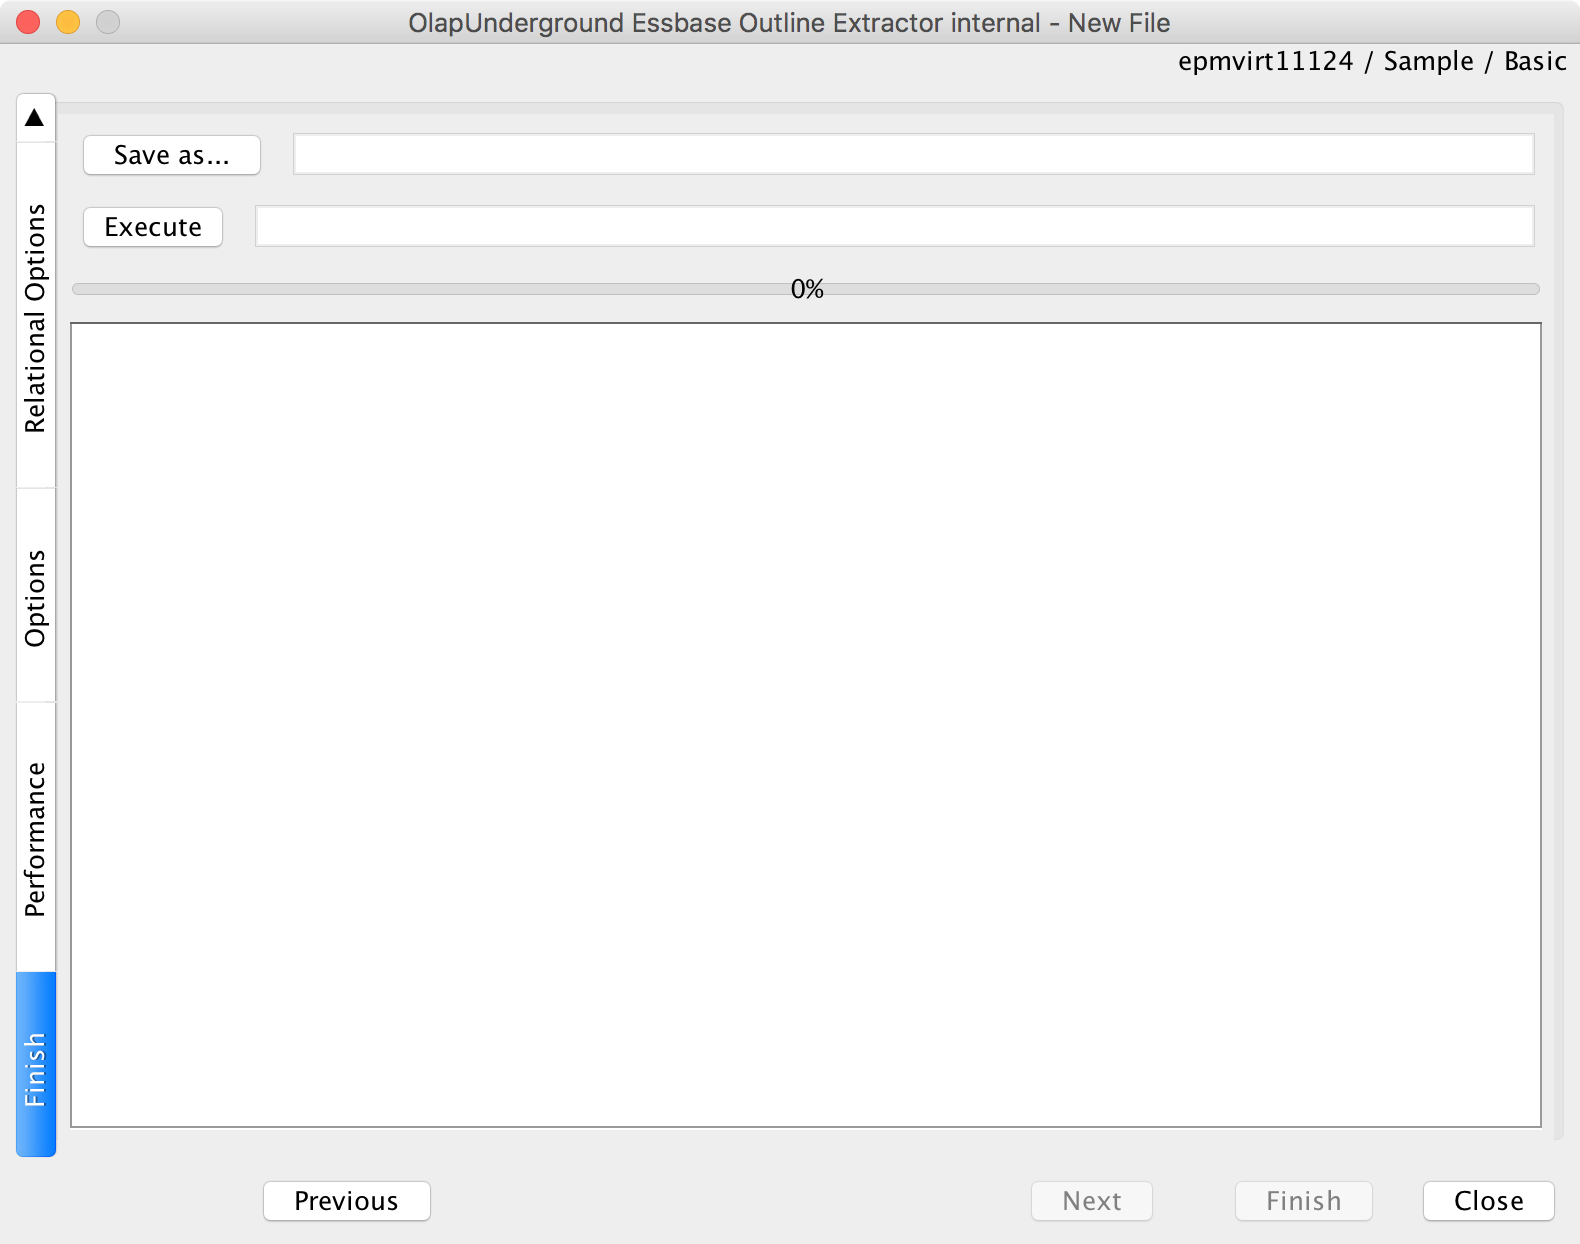
Now we’re on the pre-extraction screen. There are a couple of things to do here:

Pre-execution screen. Execute to run, Save as to save configuration

First, we can execute the extraction to perform it right now. After having performed the one-off extraction, I decide that I like it and I want to save the configuration so that I can use it again later. Therefore, I will click on the “Save as…” button and choose the name of a properties file to save to.

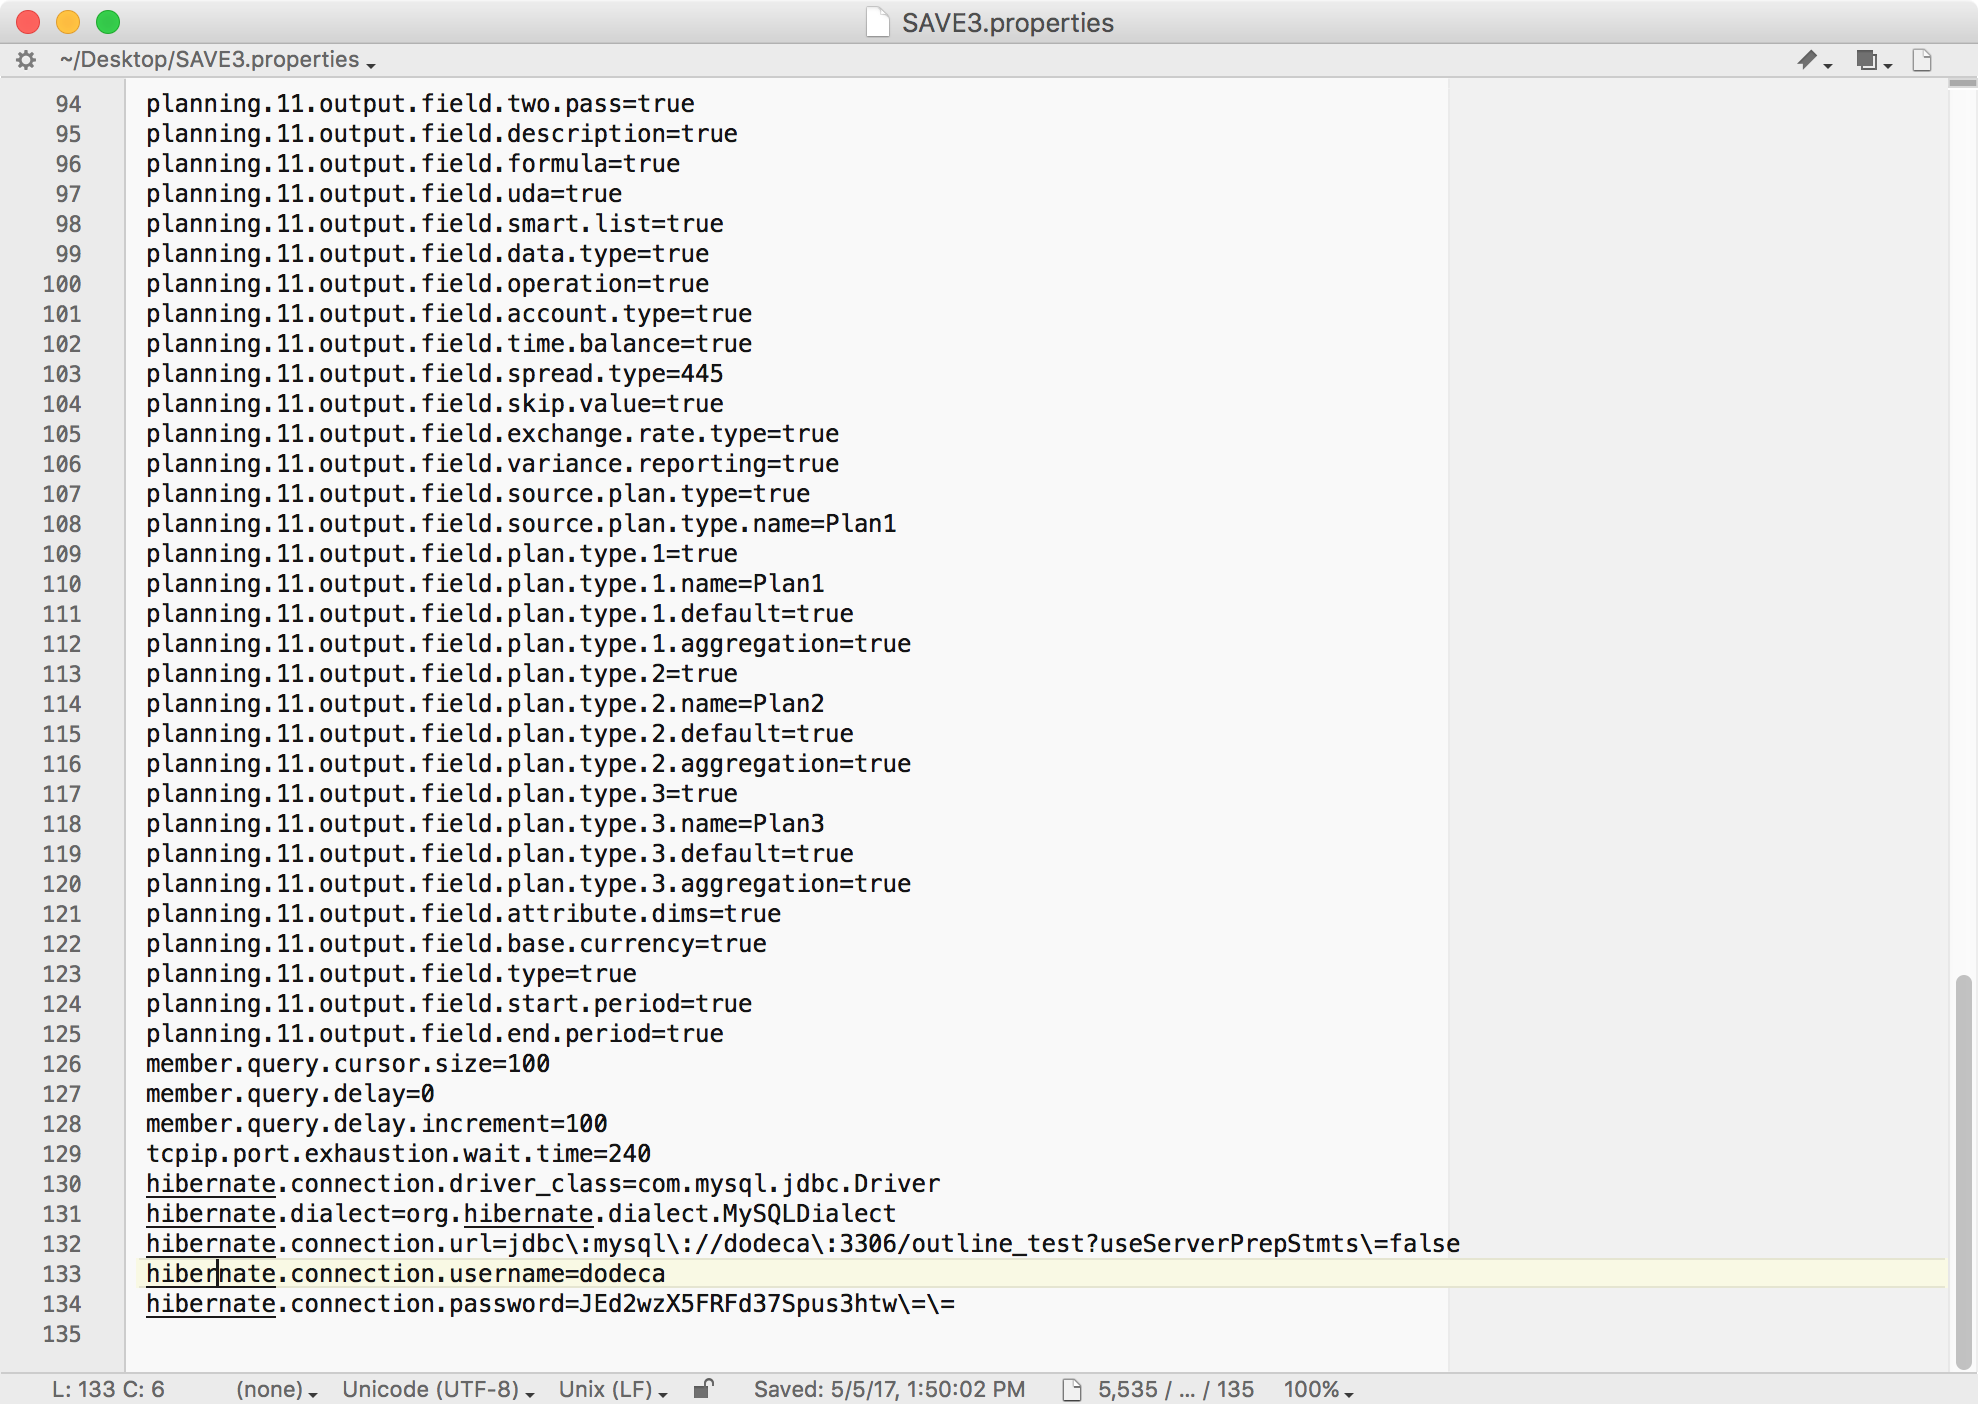
Let’s go check out what got saved into the properties file:

Contents of extraction configuration

You may notice at the end of this file, some Hibernate settings. This is the new part, as these settings weren’t in this file before, they were in a separate XML file that had to be managed. You can see that the extractor has placed in the driver type, dialect, and other connection information so that we can use it on a future extraction run. Also, the password is encrypted.

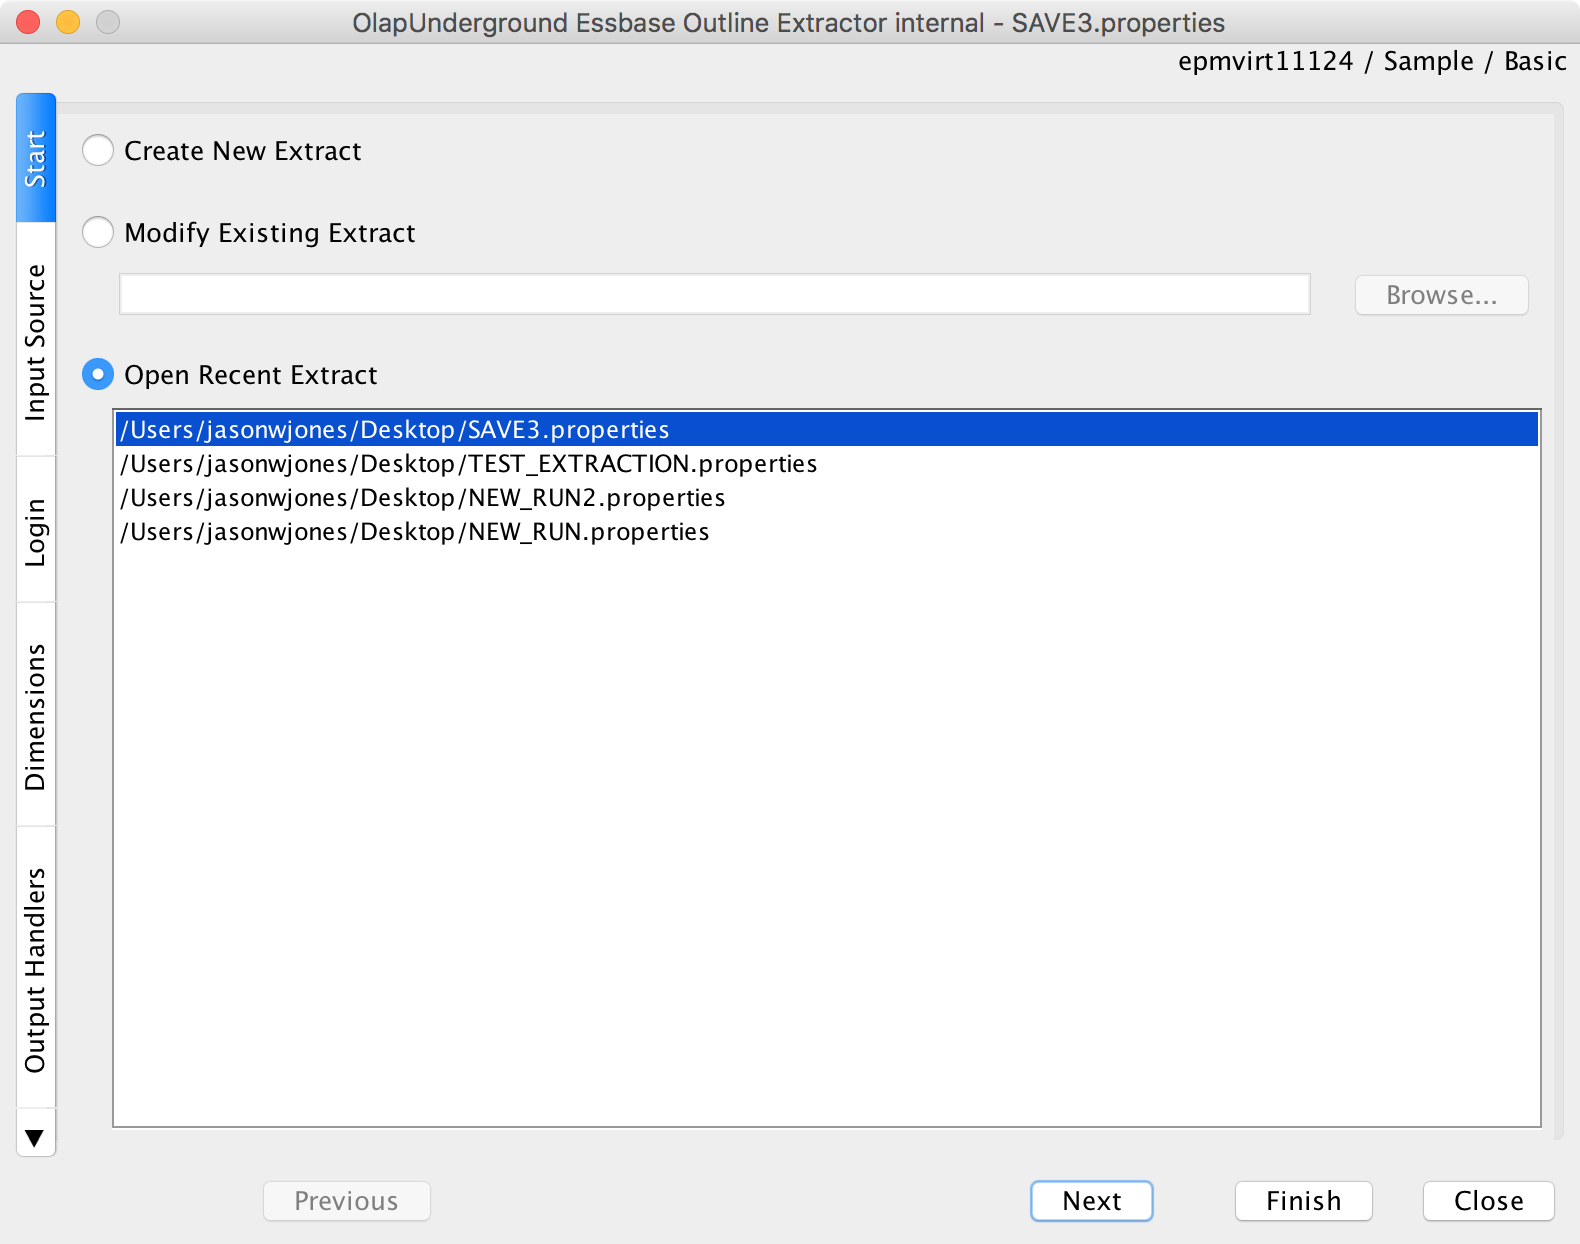
Now let’s run the extraction again and we’ll choose the properties file, indicating that we want to use the same exact settings from before (as specified in the file) to perform the extraction:

Running again, this time selecting an existing extraction configuration

Running through with the loaded properties file is exactly the same as before, just that all of the fields are pre-loaded for us. Perhaps more importantly, however, is that we can use the properties file to run the extractor on the command line. Let’s take a look at that.

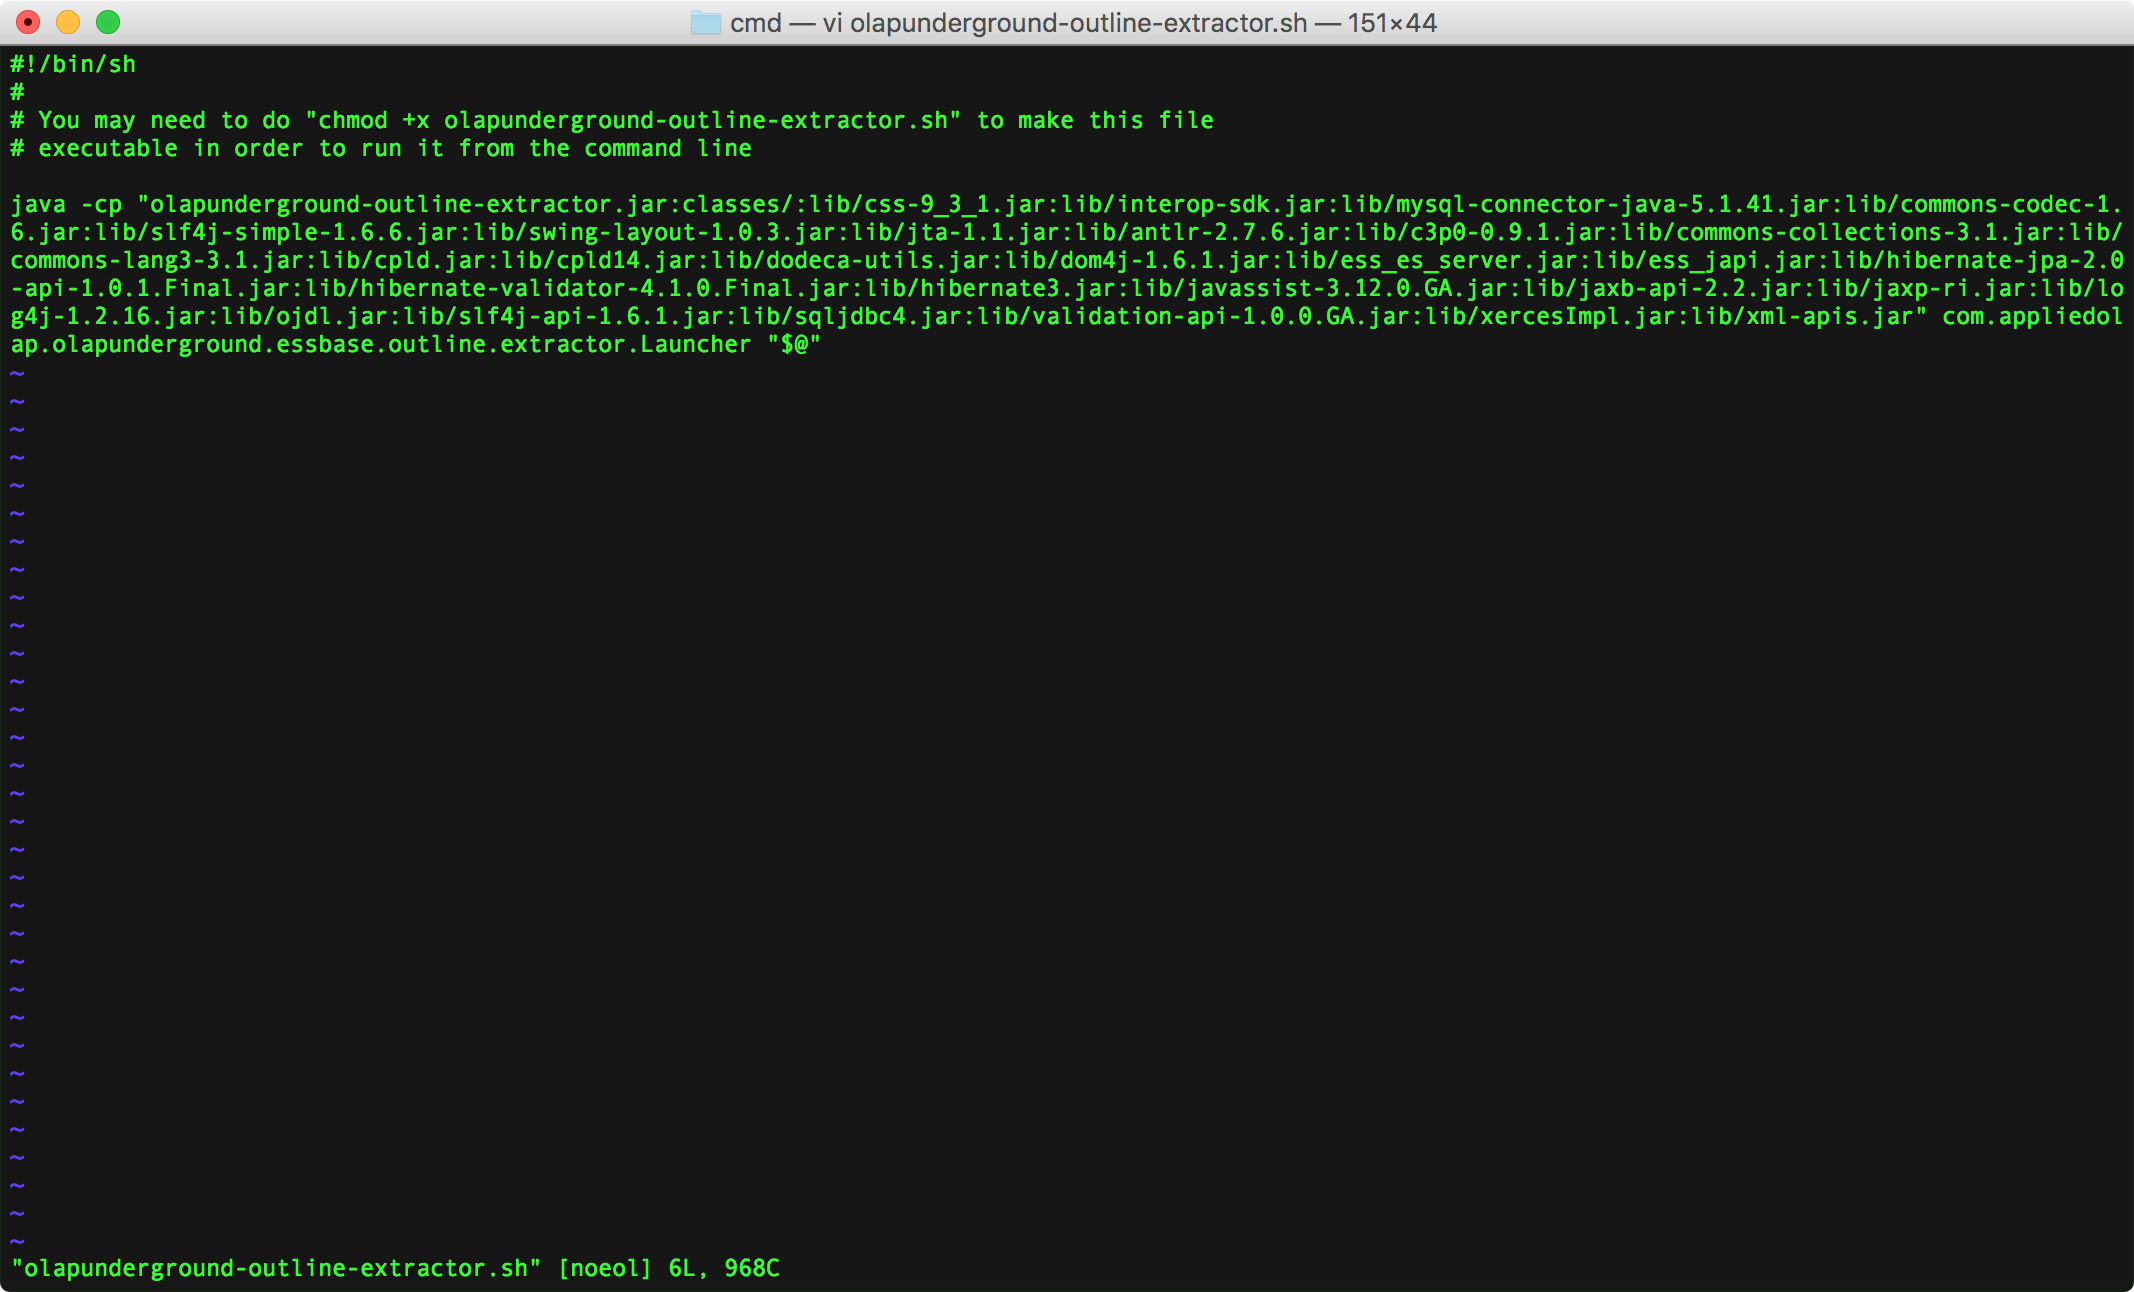
The extractor now ships with an additional shell script (olap-underground-outline-extractor.sh) that helps setup a command-line extraction for Unix systems. It previously included a file that worked on Windows, now it ships both. Here is a screenshot of that file:

Command line outline extraction helper for Unix systems

There’s not much going on here except that the extractor is run using the java command, and all arguments passed to this script are handed off to the extractor.

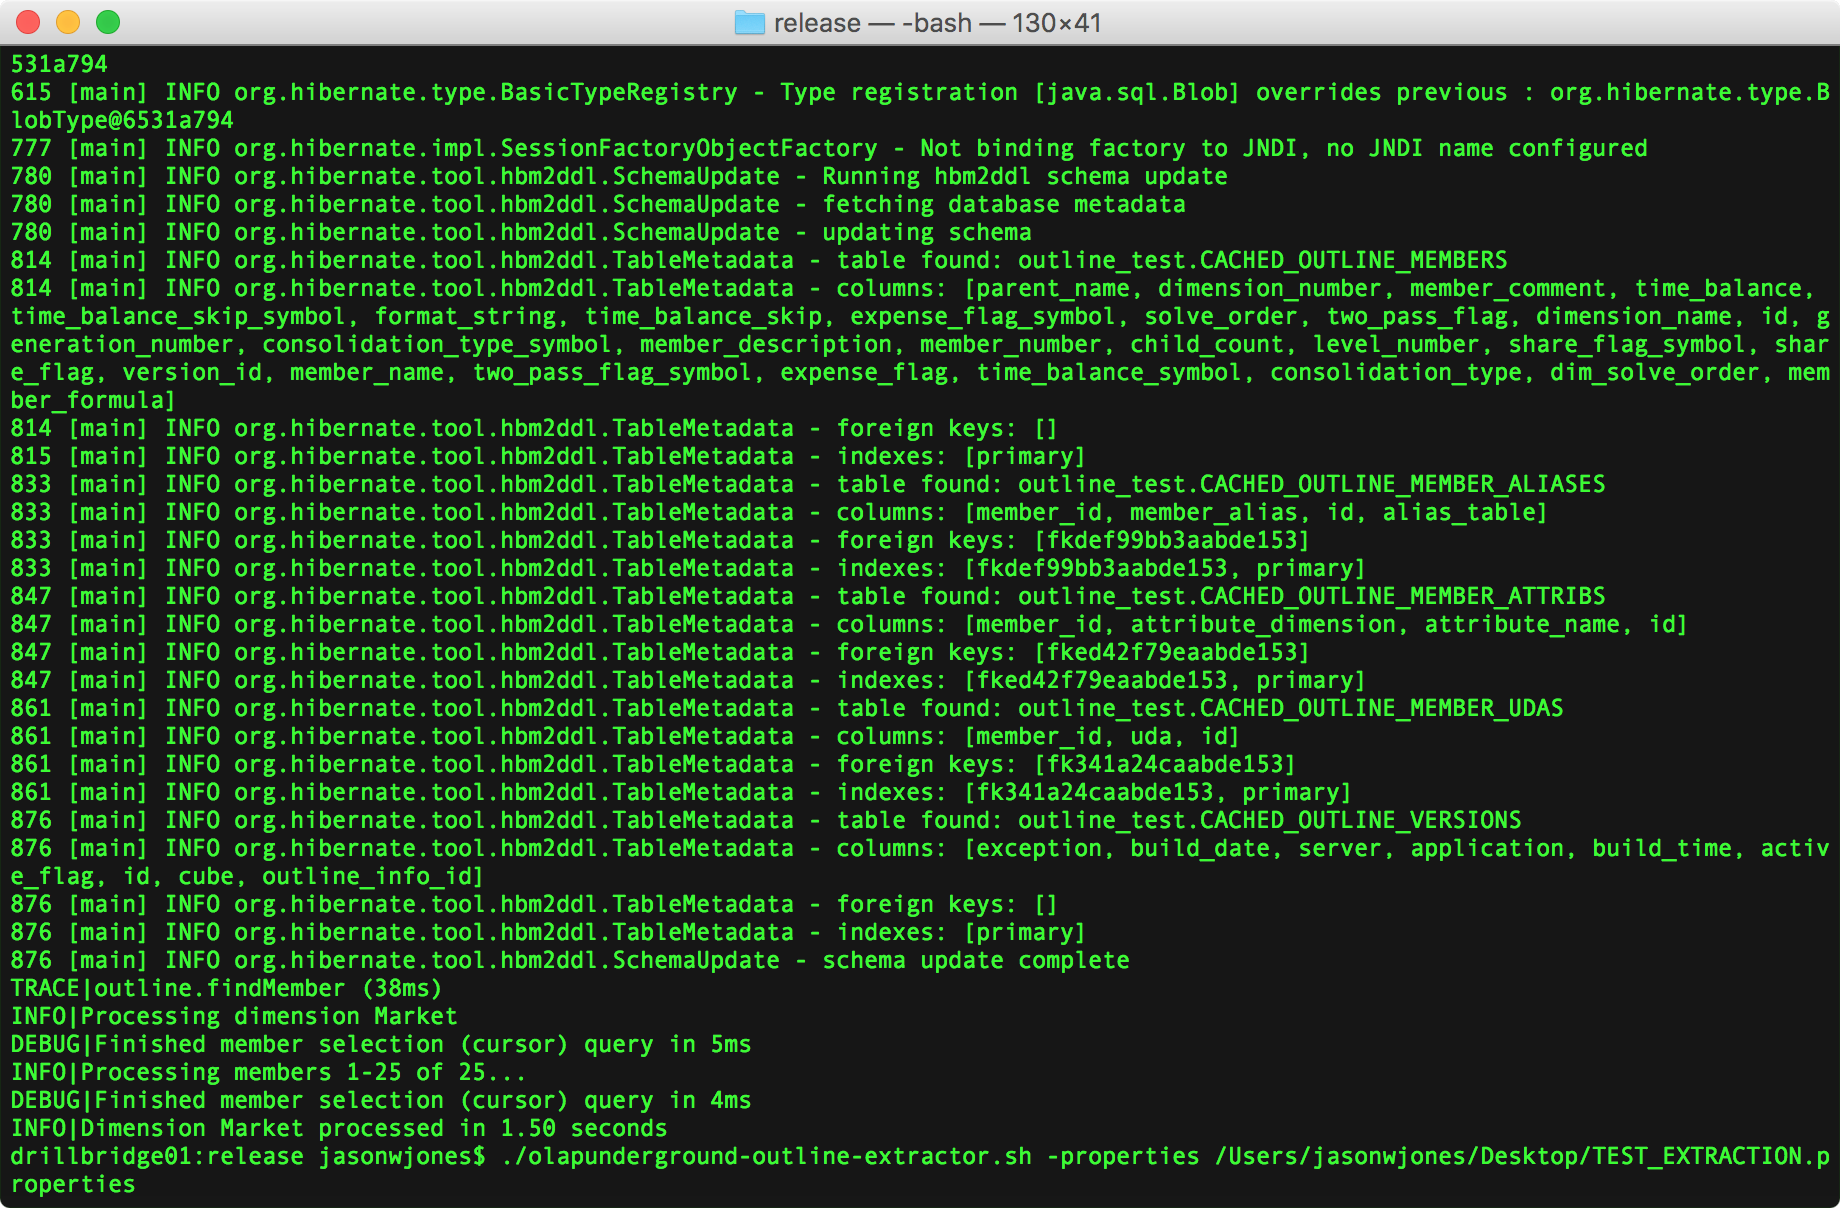
Let’s go ahead and run this script and specify the properties file from earlier:

Outline extractor command line results and example

You can see that I actually already ran the script but then for convenience just displayed the command-line I used at the bottom. The format to run with a properties file is ./olapunderground-outline-extractor.sh -properties name-of-props-file.properties.

If you care to read the output, you may notice that the extraction ran successfully, and as defined earlier, was able to use the specified strategy to extract the Market dimension and place its contents into the tables in the schema we created earlier.

Wrapping Up

The Next Generation Outline Extractor is a completely free utility that is supported, developed, and enhanced by the Applied OLAP team. It has been downloaded tens of thousands of times by many people in the EPM community.

I hope you enjoyed both this improvement to the outline extractor as well as this example of how to use this feature either for a one-off extraction, your automation, or both. The outline extractor continues to evolve and improve based on feedback from the community and users.

Release Note: This newest version of the Outline Extractor is not officially released at the moment. I’ll be released to the Applied OLAP website in the next day or two.


You Should Rethink Your Essbase/VBA Spreadsheets

Essbase is often described as getting its start in finance departments. It was finance’s secret weapon. There are a number of ways that Essbase tends to have evolved organically from this foothold. One common evolution is for the tool to gain critical importance to a company, and need to be more robustly managed by the IT department (in theory, anyway, I’ll save my thoughts on this common tragedy for another time).

One of the other common developments for Essbase in the finance department is that certain books/sheets evolve more and more functionality over time. They get augmented with automation, macros, VBA code modules, and more. This is all often on top of complicated formula references across sheets, and sometimes even across different books.

For example, a pretty common scenario for a company is that there is an Excel reporting book that is used for daily/week/monthly/yearly/whatever reporting. So you see this a lot:

  1. Open worksheet
  2. Change Time/Year members on sheet(s)
  3. Connect to Essbase
  4. Retrieve sheets to update
  5. Validate (you make sure it’s right, right?)

Over time there tend to be some extra one-off steps that are incorporated into this process, such as the need to:

  • Copy/paste cells
  • Incorporate data from additional sources/systems
  • Sort/filter data

What happens is that many enterprising analysts and organizations find ways to automate this process. They combine the Hyperion VBA module, a lot of glue code, and generally a significant amount of development. The end result is often pretty slick – on the surface: a semi-automated reporting system that streamlines a manual, error-prone, and time-consuming process.

With Great Spreadsheets Comes Great Risk

People are usually pretty excited at this point: the reporting process is quicker and easier. The value of Essbase has been enhanced. There is more time for other important activities. The code is still fresh in mind.

Over time, things change. Requirements change. The code changes. People and departments change. Quite often, the person that wrote the original and highly complex automation code moves on.

“Well, Chuck originally wrote this book, he was a real wizard with all of this stuff, but he quit a couple of years ago so we just kind of tweak it here and there but we don’t really know how it works. If this ever breaks, we are screwed.”

Others try mightily to wade through the byzantine code and put some duct tape on. Very often in this scenario, a company also makes a transition from the classic Excel add-in to Smart View. Many companies are forced to try and upgrade the solution (which in many cases was never an “official” solution to begin with), to the completely different Smart View API. Many of these solutions don’t ever get migrated – they get thrown away since it is just too much effort and risk to maintain or convert.

The Best Code Is No Code

I talk to a lot of people that are looking for a way to extend the life of their in-house VBA reporting/analysis solutions. And sure, you can use the Dodeca Excel Add-In VBA translation module as a drop-in solution to do just that. This can be a good stopgap solution. But it can be better.

What I so often tell people in this situation is to try not think “How do I replace this code?” – and instead think more holistically about the solution. These solutions also tend to have a huge amount of the verbose, repetitive, low-value, confusing and undocumented code that does things like:

  • Gather credentials
  • Connect to Essbase
  • Solicit member selections from the user
  • Retrieve one or more ranges on one or more sheets
  • Receive user input
  • Run a calculation

As it turns out, these are all tasks that Dodeca handles out of the box – with no code. You can simply define a named range on an Excel template and have Dodeca handle all of the details of connecting and retrieving. You avoid tons of complex logic trying to get member selections from the user (or relying on them to key them in manually, correctly) with Dodeca’s flexible selectors, data input is handled just as easily as retrieves, and custom calculations are simple to run – all just by configuring a few options on a Dodeca Essbase Excel view, and again, with no code.

Perhaps more importantly, since Dodeca centralizes the spreadsheet templates and reports, you don’t have to worry about distributing Excel books all over the place such as with email, and you don’t have to worry about syncing up changes and making updates.

I love laying down some code as much as the next person, but perhaps more than that, I like developing effective solutions that are high quality and give my users what they want. And Dodeca’s Essbase functionality and spreadsheet paradigm delivers over creaky VBA solutions any day of the week. To borrow an analogy – don’t try and build a faster horse: get a car.


PBJ 1.0.4 – New password options and start of CLI

The PBJ library has been getting a lot of attention lately from various developers using it to integrate with their own software and projects. Francisco Amores did a great blog post about using PBJ to help with data loading in an FDMEE project. Probably the coolest thing about his efforts is that it’s  use-case I never imagined: using PBJ in Jython to access PBCS.

One of the things that has been so great about collaborating with Francisco is getting targeted, useful, and practical comments on how he’s using the library and how it can be made better. And I have found time to make various improvements, enhancements, and fix bugs to address his feedback. This is one of the greatest things about open source software.

While Oracle provides some workable Java code in the PBCS REST API documentation, it’s akin to the old Java examples that ship/shipped with the Essbase Java API – they get the job done, but most people are going to copy and paste them, and end up reinventing the wheel in the process. Since day one, PBJ has striven to be a single, high-quality library that fits in well with enterprise Java (or Jython in the case of the FDMEE integration scenario), and is completely open-source with a license that is very well suited to giving businesses the flexibility they need.

Latest Improvements

Some bugs related to loading/importing data have been fixed. Additionally, new options are available for signing on to a PBCS instance. You can now create a connection object using a Base64 encoded password. Note that this isn’t meant to be an incredibly secure password storage mechanism. Mostly what it buys you is that if you have a raw script in something like FDMEE, you can avoid having a totally clear password. Of course, all communication with the REST API itself is over HTTPS, so you’re secure there as always.

One of the coolest improvements I was able to make lately to PBJ was to package the library as a single JAR file that makes it even easier to integrate into other projects. It turns out that PBJ uses some of the same Java libraries that FDMEE does and there was a conflict, but with Francisco’s feedback I was able to adjust things to avoid the conflict.

CLI Anyone?

There’s just one other really, really, cool (in my opinion) thing I started implementing in the PBJ library: a CLI. Now that PBJ is packaged as a single JAR file (if you want), it’s also a runnable JAR file (my preferred method of deploying Java applications that run on the command-line as it prevents a lot of hassle with classes, the class path, batch files, and other things). I’ve implemented a couple of really basic commands and can add more as time permits.

Here’s an example:


java -jar pbj-pbcs-client-1.0.4-SNAPSHOT.jar \
--conn-properties=/Users/jasonwjones/pbcs-client.properties \
--no-logging \
list-applications

This can be entered as a single line on the command line, but I have broken it up into multiple lines by using backslashes. If you’re not familiar, the backslash is used in many environments to “escape” the following character. Typically this is a newline or another backslash, but if it’s the last thing on the line, then it’s literally escaping the newline itself, meaning that an interpreter or the shell will treat multiple lines as a single line.

To avoid having to put the username/password/server on the command line, a simple properties file is used to provide that information. Then the command list-applications is given.

Here’s the output:


Vision
TestApp

Here’s the full output when run without any parameters, which explains the usage:


Usage: <main class> [options] [command] [command options]
  Options:
    --conn-properties, -C
       
    --debug-logging
       
       Default: false
    --no-logging
       
       Default: false
  Commands:
    list-applications      List available applications
      Usage: list-applications [options]

    encode-password      Encode a password for use in a connection
      Usage: encode-password [options]
        Options:
        * --plain-password
             

    get-member      Get information on a member in an application
      Usage: get-member [options]
        Options:
        * --application
             
        * --dimension
             
        * --member

But I can do that with EPMAutomate, right?

Absolutely. This shell isn’t meant to be a replacement for EPMAutomate, but in theory it can do everything that EPMAutomate can do. And more commands can be easily implemented. This is one of the beautiful things about Oracle having published a REST API that anyone can use. One of the potentials for this library that I can see is that since the project is completely open source, the community could easily add convenience methods or commands to work with PBCS. This could lead to the ability to cleanup on automation that uses batch/shell scripts and instead just add a couple of handy options to the CLI here. In fact, I even have an ad hoc grid library for PBCS that could be integrated with this client and expose some functionality that isn’t even in EPMAutomate.

As you can see, not too many options are implemented right now, just some proof of concept items with “get-member” and “list-applications“. But others can easily be added in. All of the new source code is available in the PBJ GitHub repository for anyone to clone, edit, use, or whatever. The GitHub repository has instruction son how to build but I think next week I’ll try and post a quick video showing how you can clone the code, build it locally, and use it in your own projects.

My Top 10 Favorite Drillbridge Features

Drillbridge is a tool with an ostensibly narrow focus – drill from Essbase/Hyperion data to somewhere else. Typically that “somewhere else” is the relational data that has been summarized to load into the cube. While the concept of drill-through is very simple in principle, Drillbridge has been extensively engineered to make take this simple process and augment it with dozens of features that enhance its usefulness.

That said, in no particular order, I thought it might be fun to point out my ten favorite Drillbridge features.

Get Around the 1,000 Item Limit in Oracle

Many traditional drill-through implementations run into an issue when drilling to more than 1,000 items. This generally happens when drilling from an upper-level member, such as high up in the Accounts of Entity dimension. Typically how this is implemented is that all of the level-0 descendants of the drilled member are placed into a SQL SELECT statement using the IN clause. For example, drilling on Qtr1 in an outline could yield a query like the following:


SELECT * FROM Transactions
WHERE MONTH_NAME IN ('Jan', 'Feb', 'Mar')

Most versions of the Oracle relational database, however, have a hard limit of 1,000 entries in the IN clause. Drillbridge provides an advanced syntax for getting around this by letting you specify how to break the items into multiple groups to get around the 1,000 item limit. For example, imagine that the limit was actually three items in a single IN clause and you had five items that you needed to check for:


SELECT * FROM Transactions
WHERE (MONTH_NAME IN ('Jan', 'Feb', 'Mar') OR
MONTH_NAME IN ('Apr', 'May'))

Paging

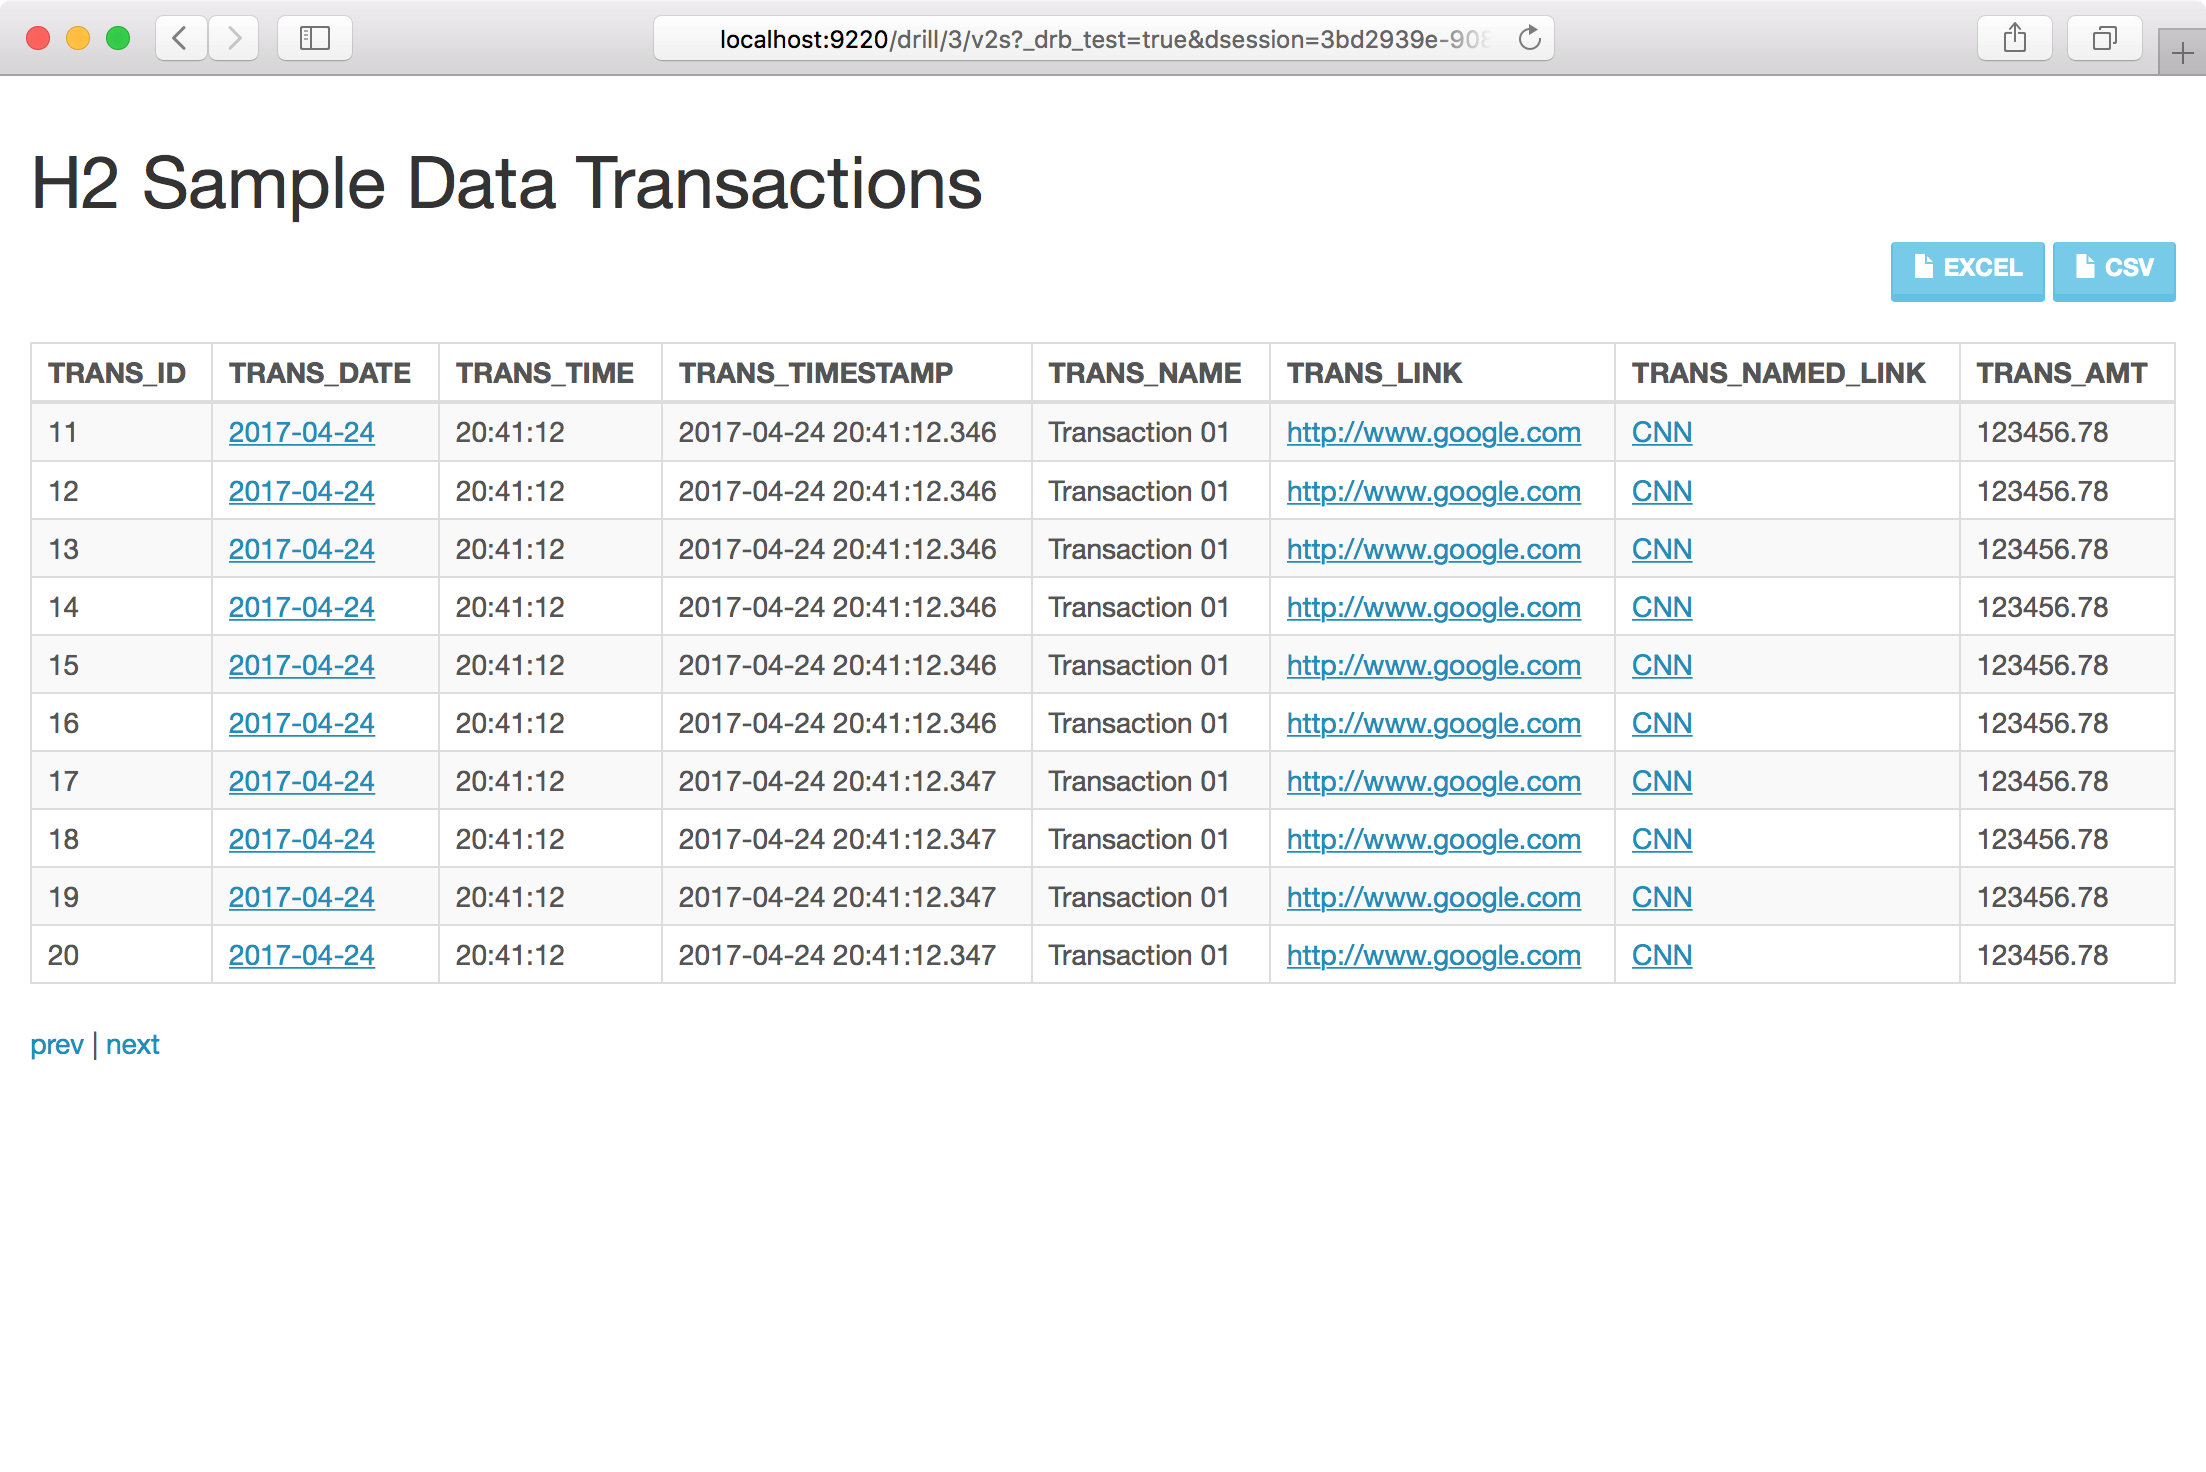
Drillbridge reports can be configured to break the results into several pages and allow the user to page through them. This can provide numerous benefits. The biggest benefit is to the user experience. Instead of waiting for 100,000 rows to load in, a particular report might be configured to break the results up into pages of 10,000 rows each. This can improve the user experience by making the browser more responsive (since there is less data in memory), and make it so the user can start viewing data before all of it has returned from the relational database. The user will be presented previous/next buttons in the interface to quickly navigate between pages:

Drillbridge paging feature

Drillable Columns

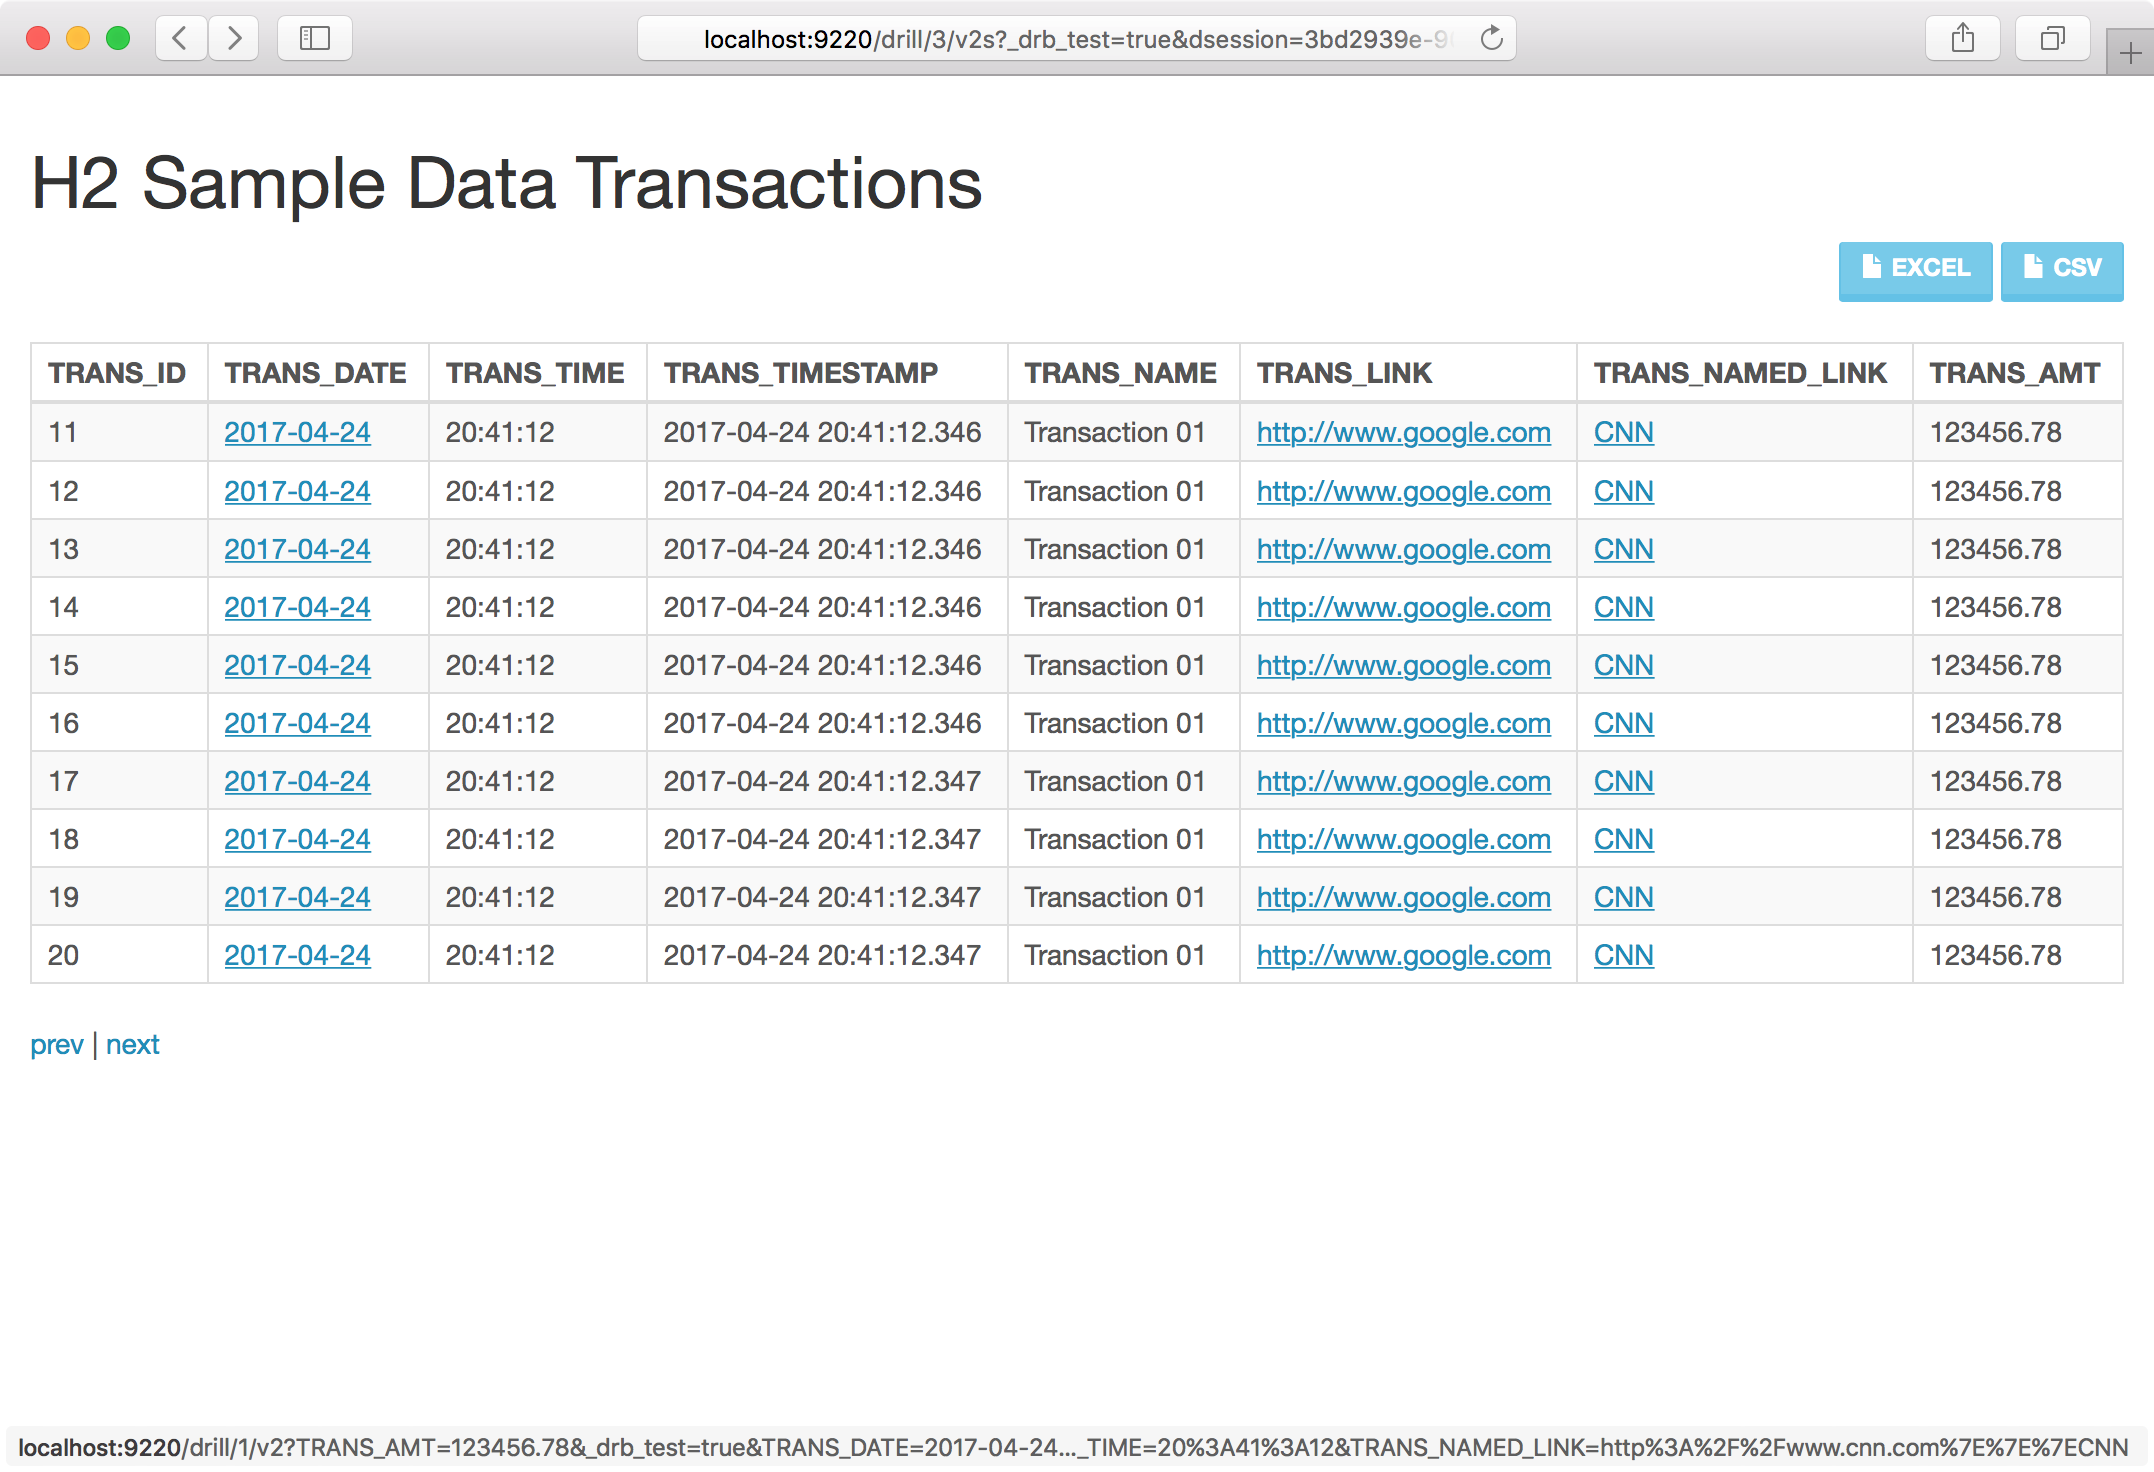
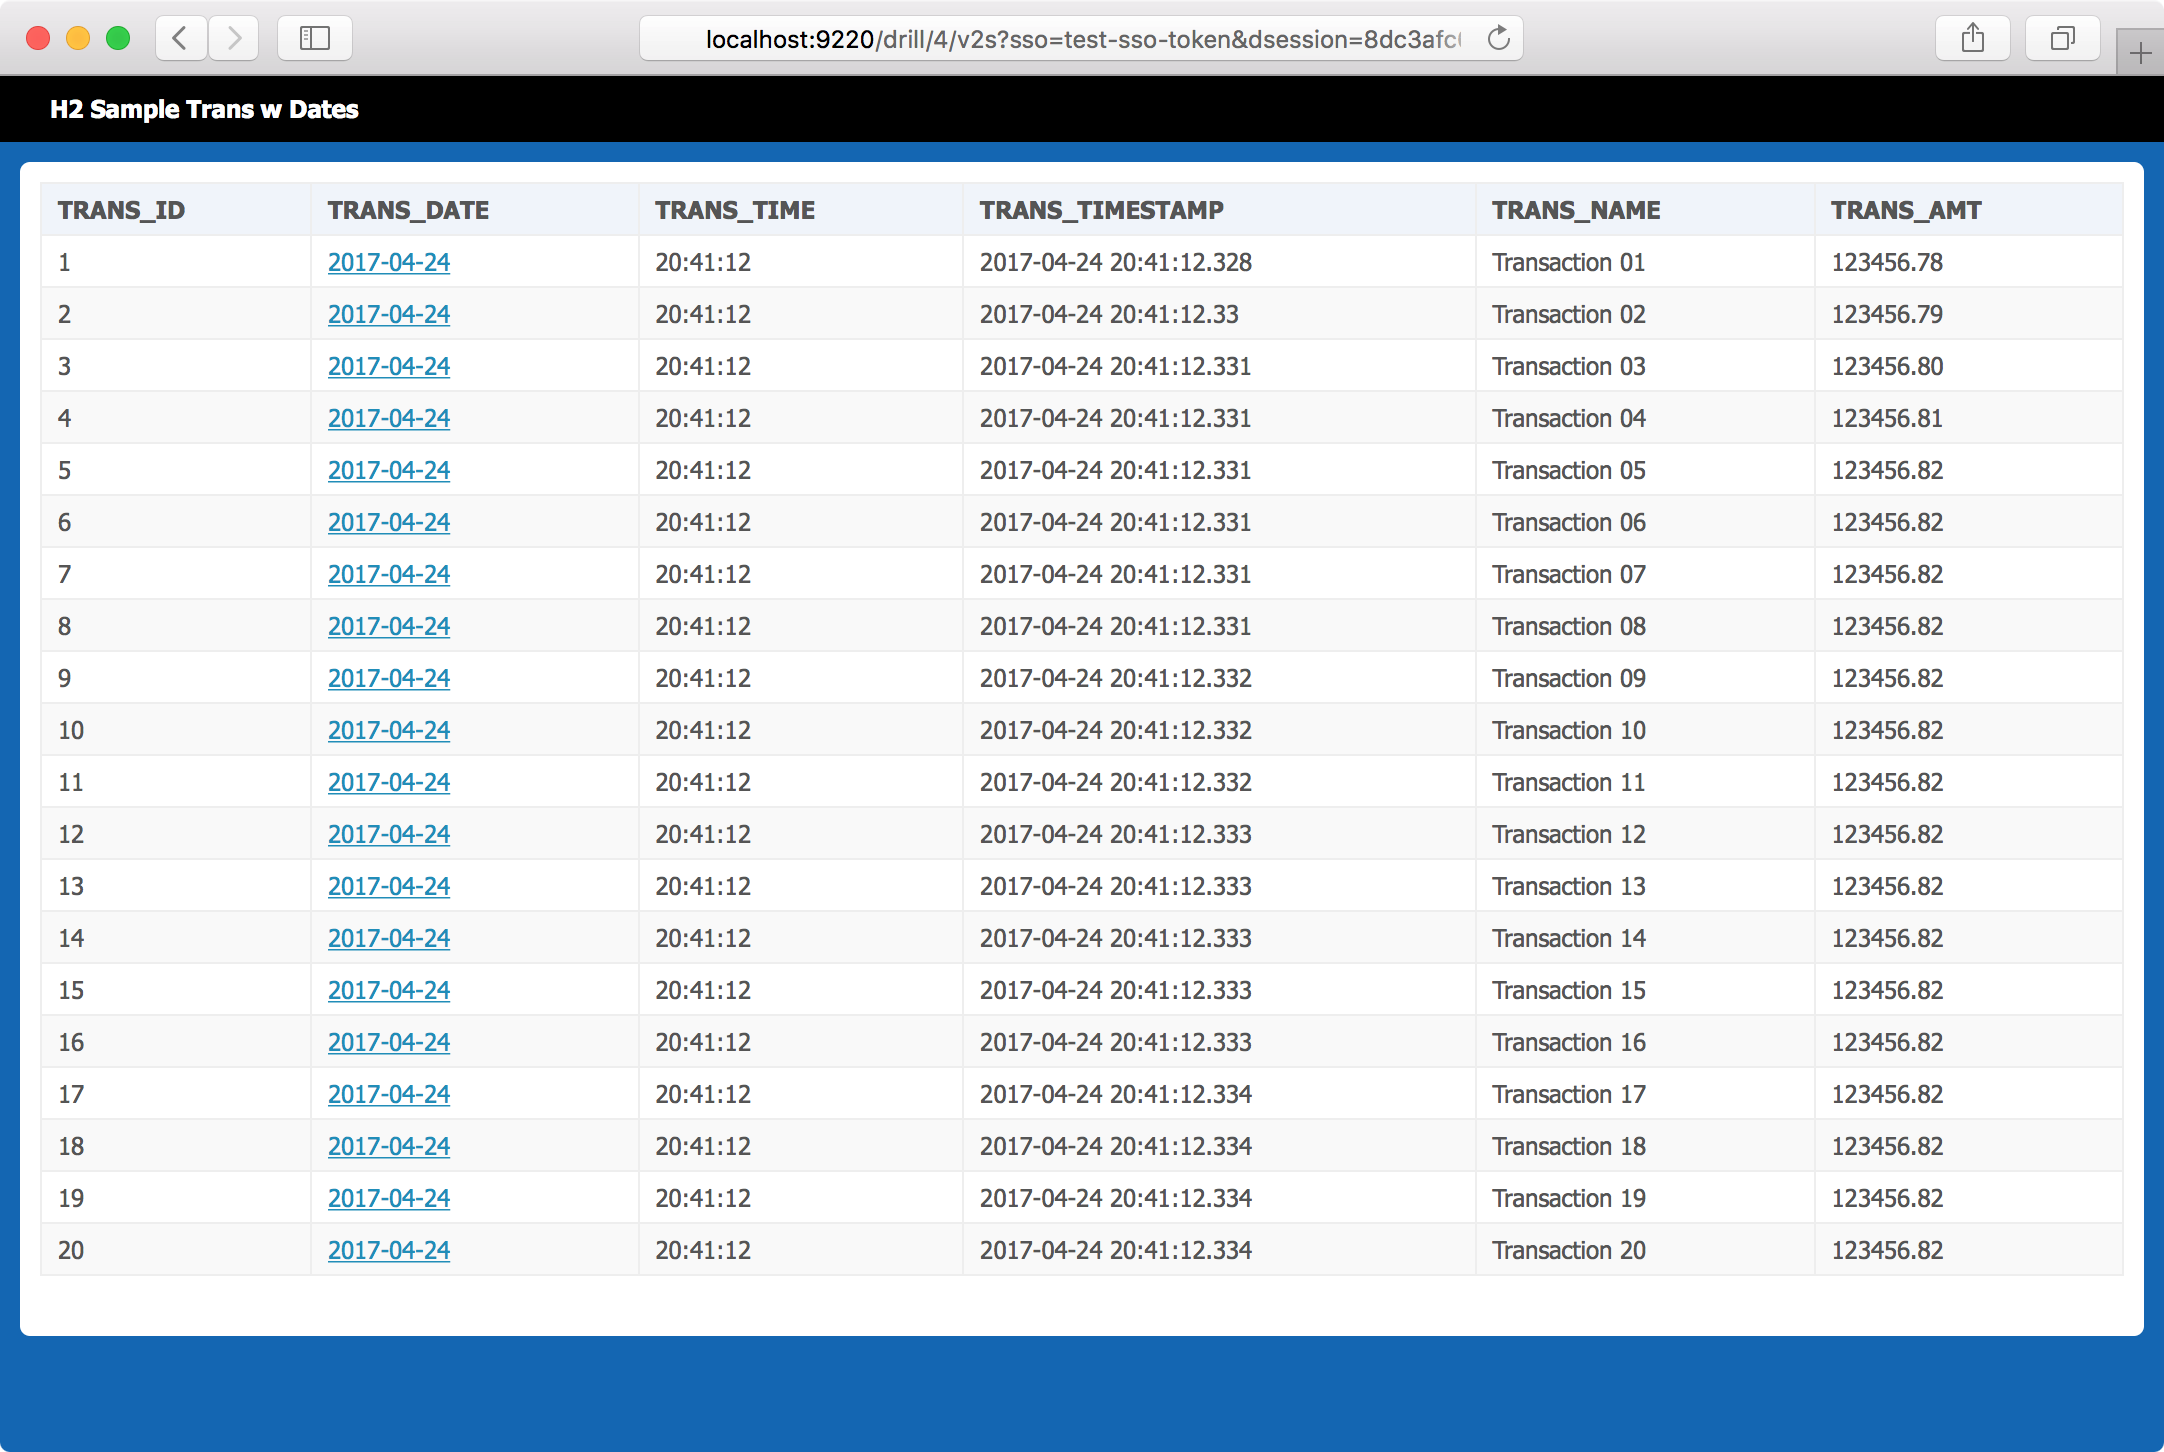
Drillable columns are one of the ways that Drillbridge allows for providing even more ability for the user to get context around their data. With drillable columns, any column or set of columns in a report can be configured to automatically link to another report. When the user clicks the link, Drillbridge will run the new report using the current POV combined with the POV of the row. For instance, if the user originally drilled into transactional detail and then wanted to drill on a particular transaction, the original POV (month, account, etc.) and the transaction number would be combined to launch the new report.

Drillable columns are also one of primary reasons why I like drilling into a web page instead of just plain/raw data in an Excel tab. Here’s an example with drillable columns:

Drillable columns in Drillbridge

If you look carefully you can see that the link at the bottom of the browser window actually includes all of the parameters from the POV and that particular row, enabling the target report to use the source parameter as it would any other parameter.

Drill to URL

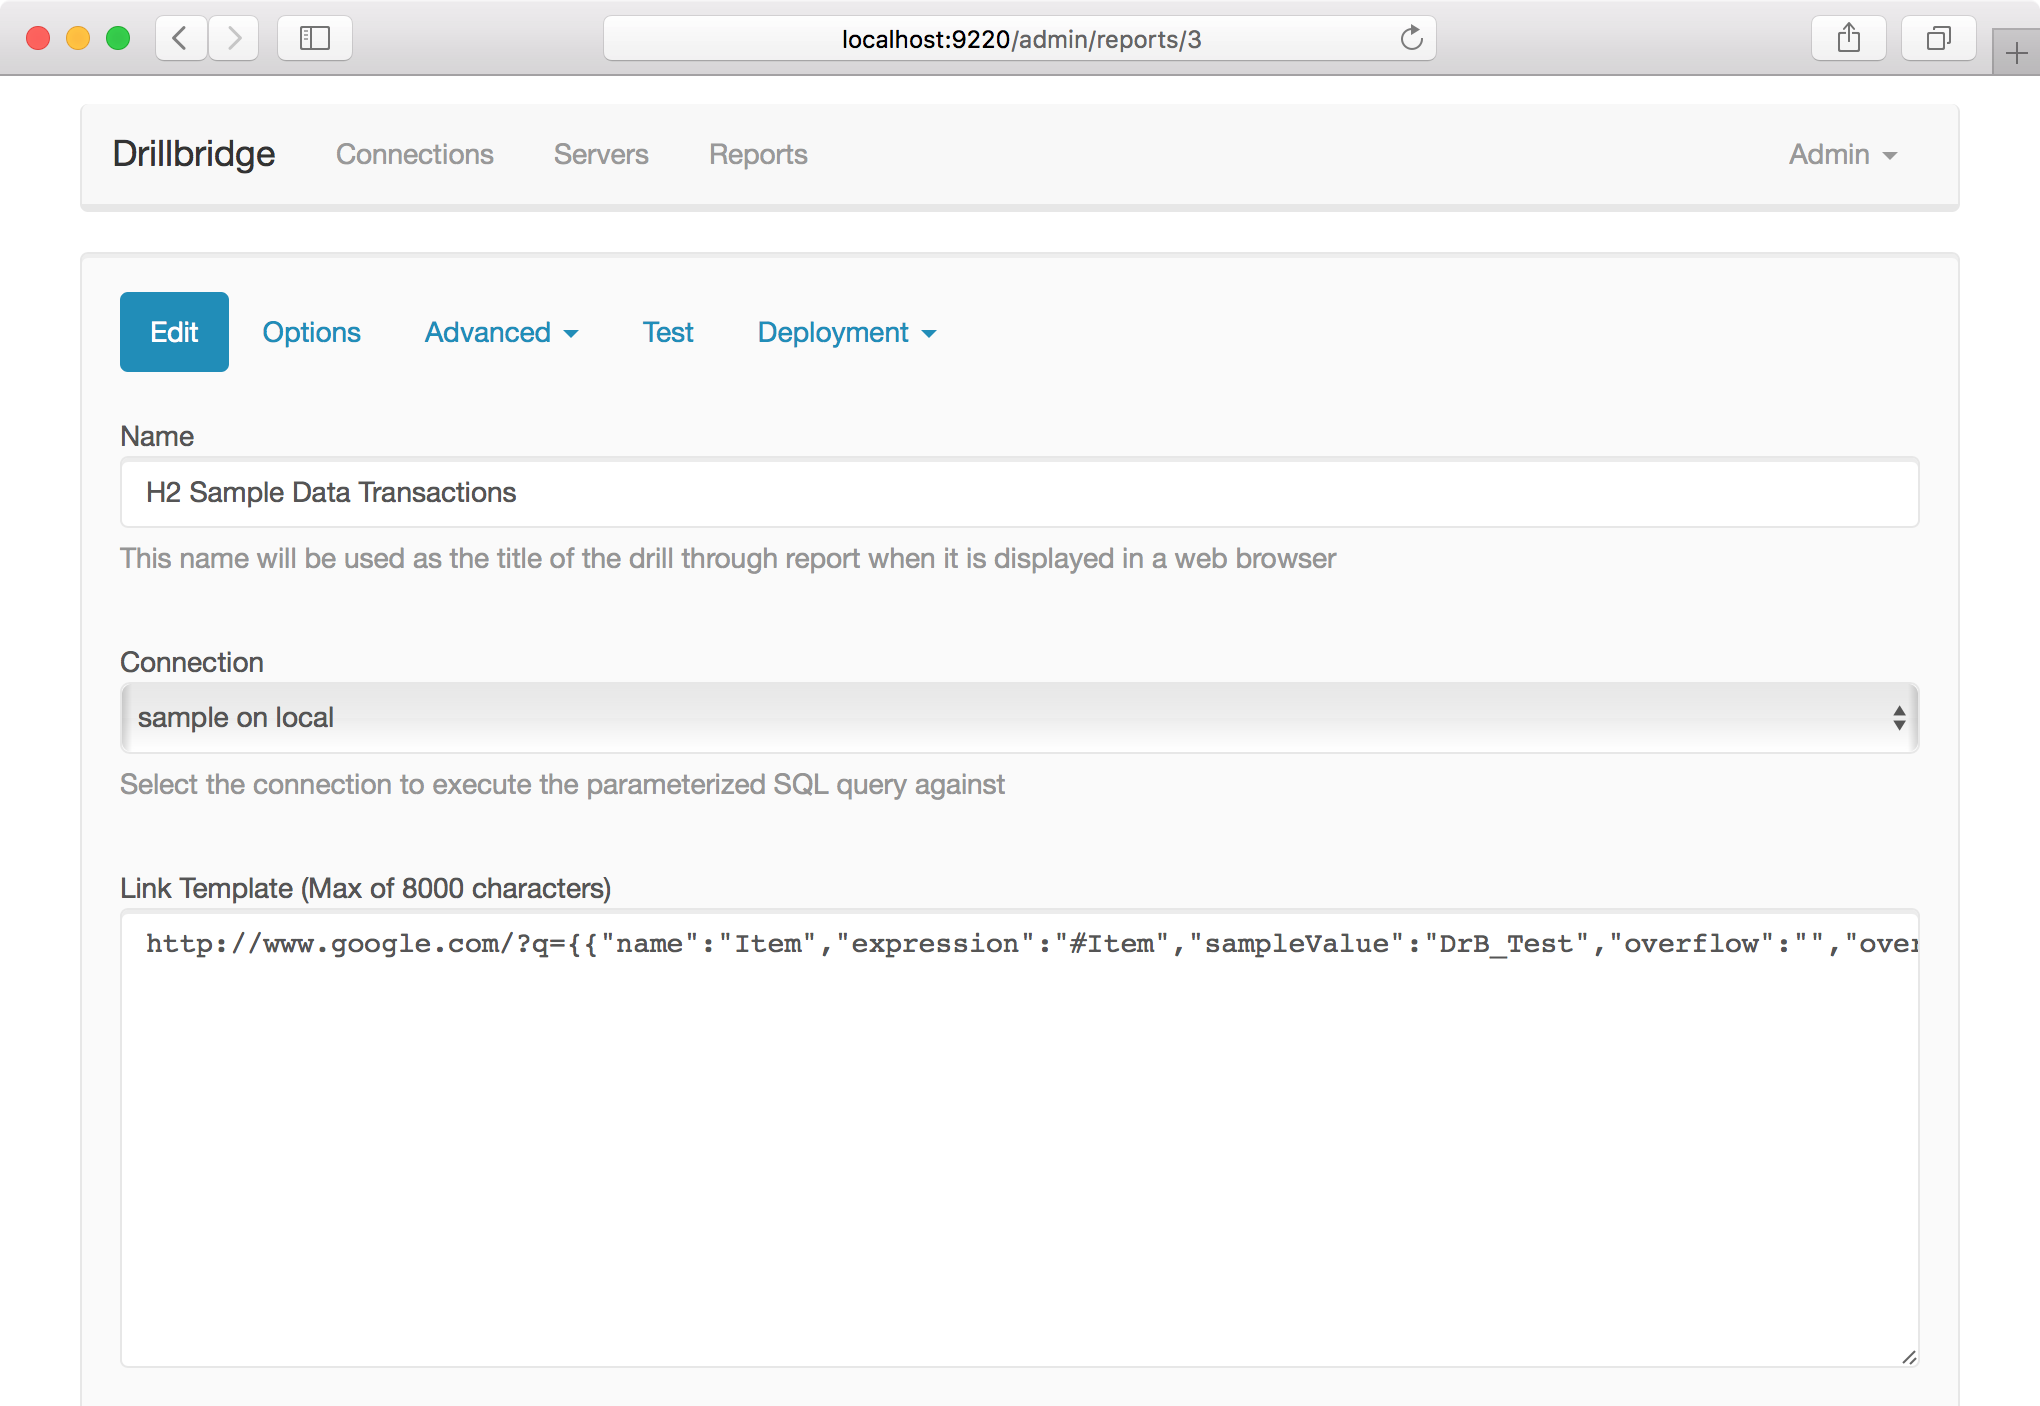
The fundamental concept behind Drillbridge is that it flexibly creates a SQL query based on a given POV and it provides incredibly enhanced functionality for crafting that query. Drillbridge provides an additional report type out of the box that instead of generating a SQL query, generates a hyperlink, and contains all of the same functionality for mapping from the POV to a link that you’d expect in a normal report. For demonstration purposes, here’s an example query template:

Editing a Drillbridge URL forwarding report

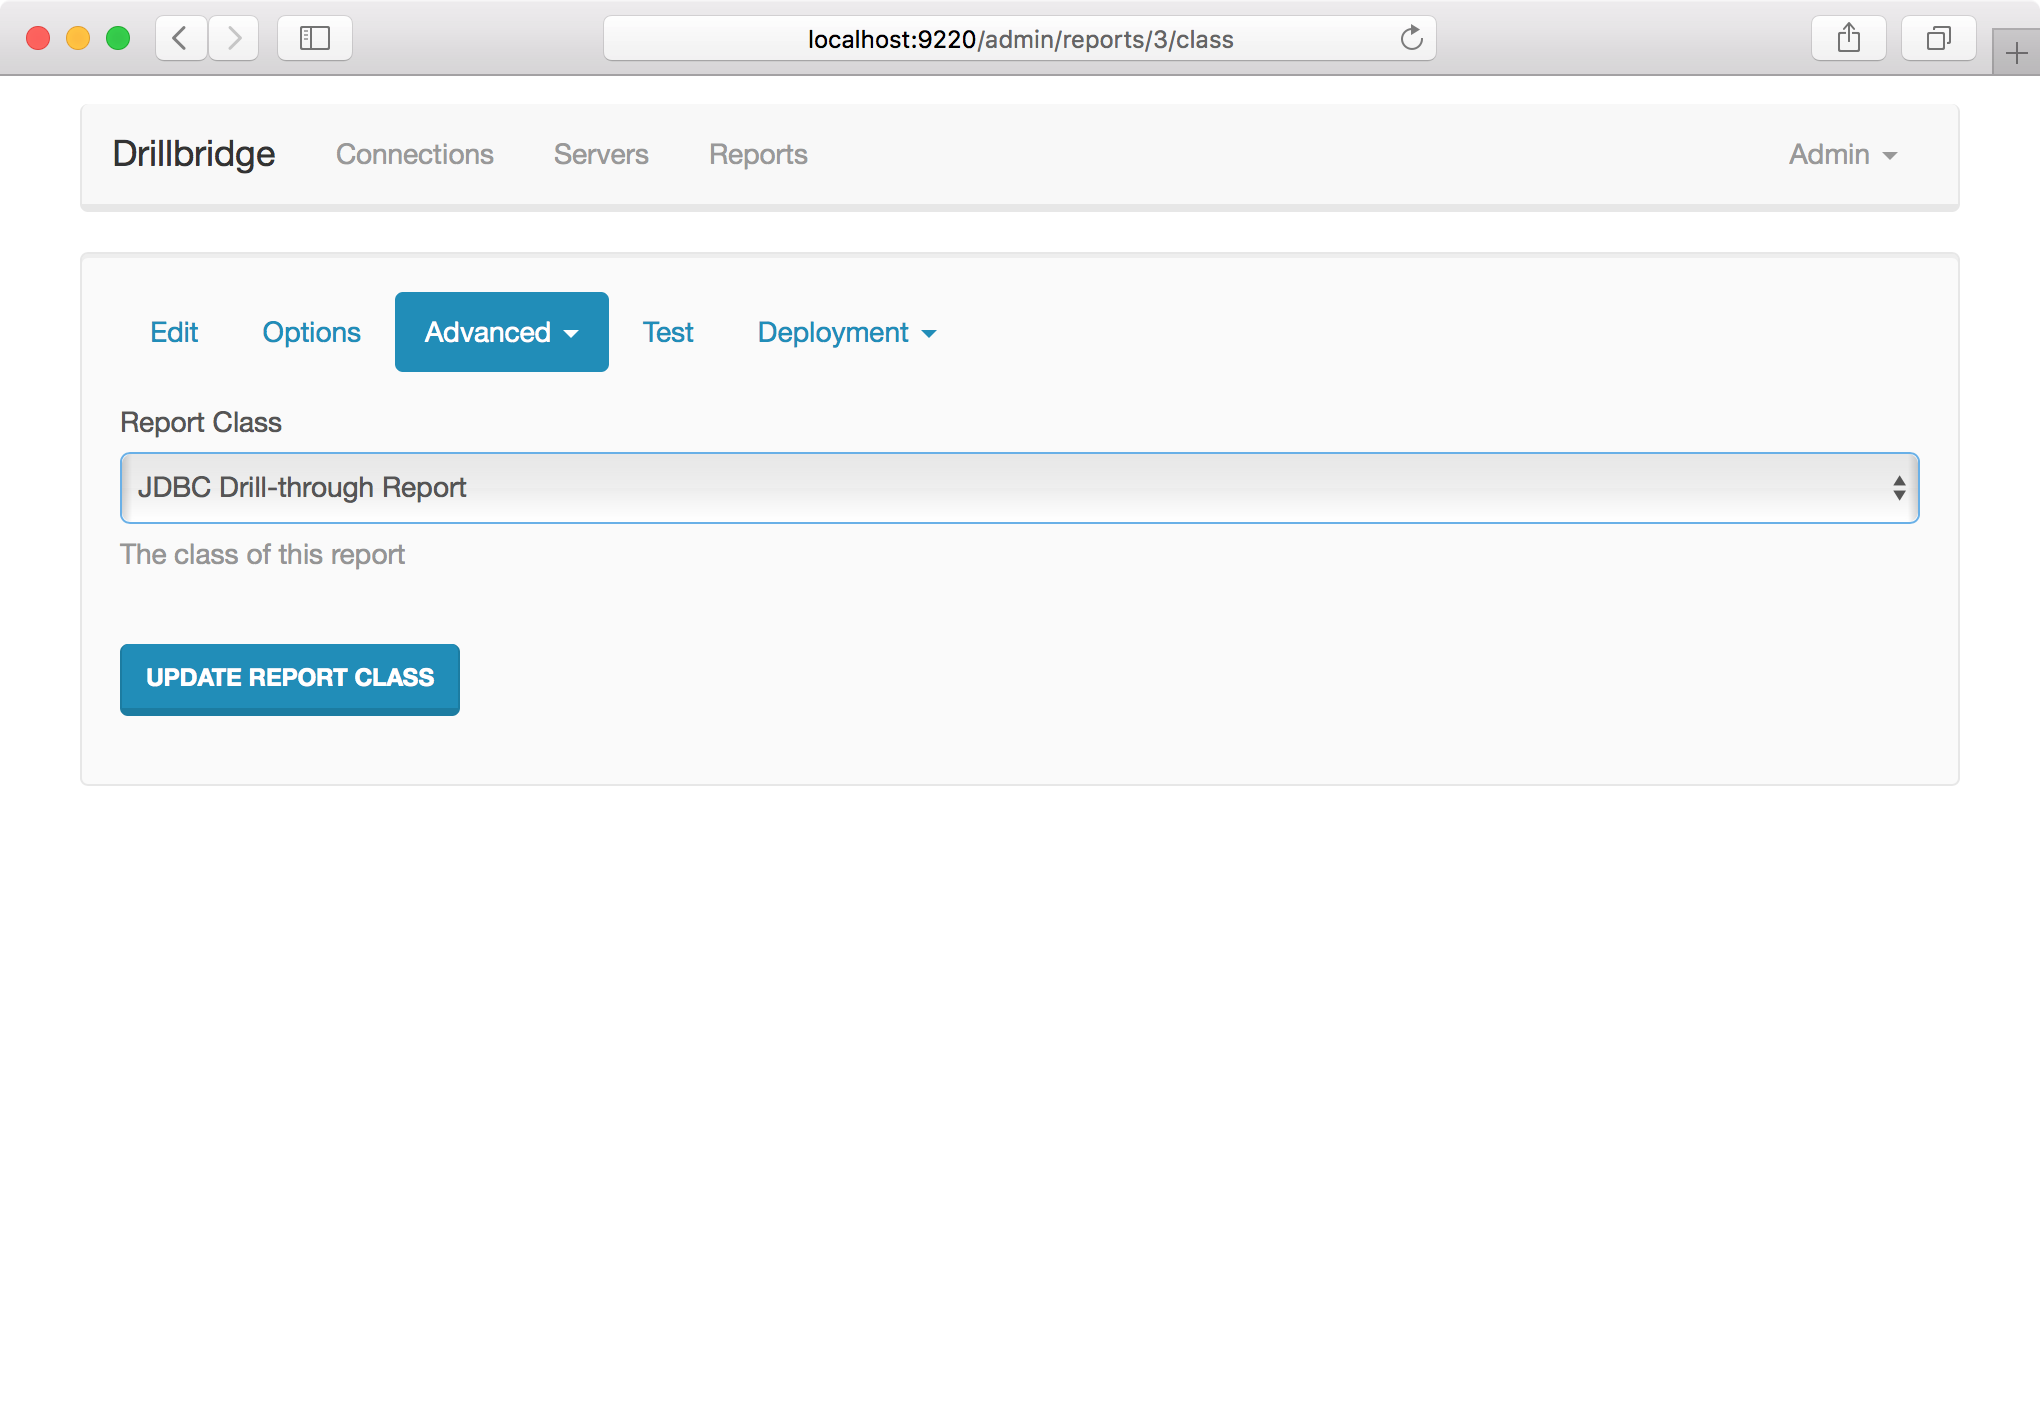
Notice that instead of a query we are editing the “Link Template” and that it starts with http rather than the more traditional SELECT we are used to seeing. I’m able to do this because I set the type of the report to a Forwarding Link report instead of JDBC Drill-through Report (the default):

Changing the class of a report

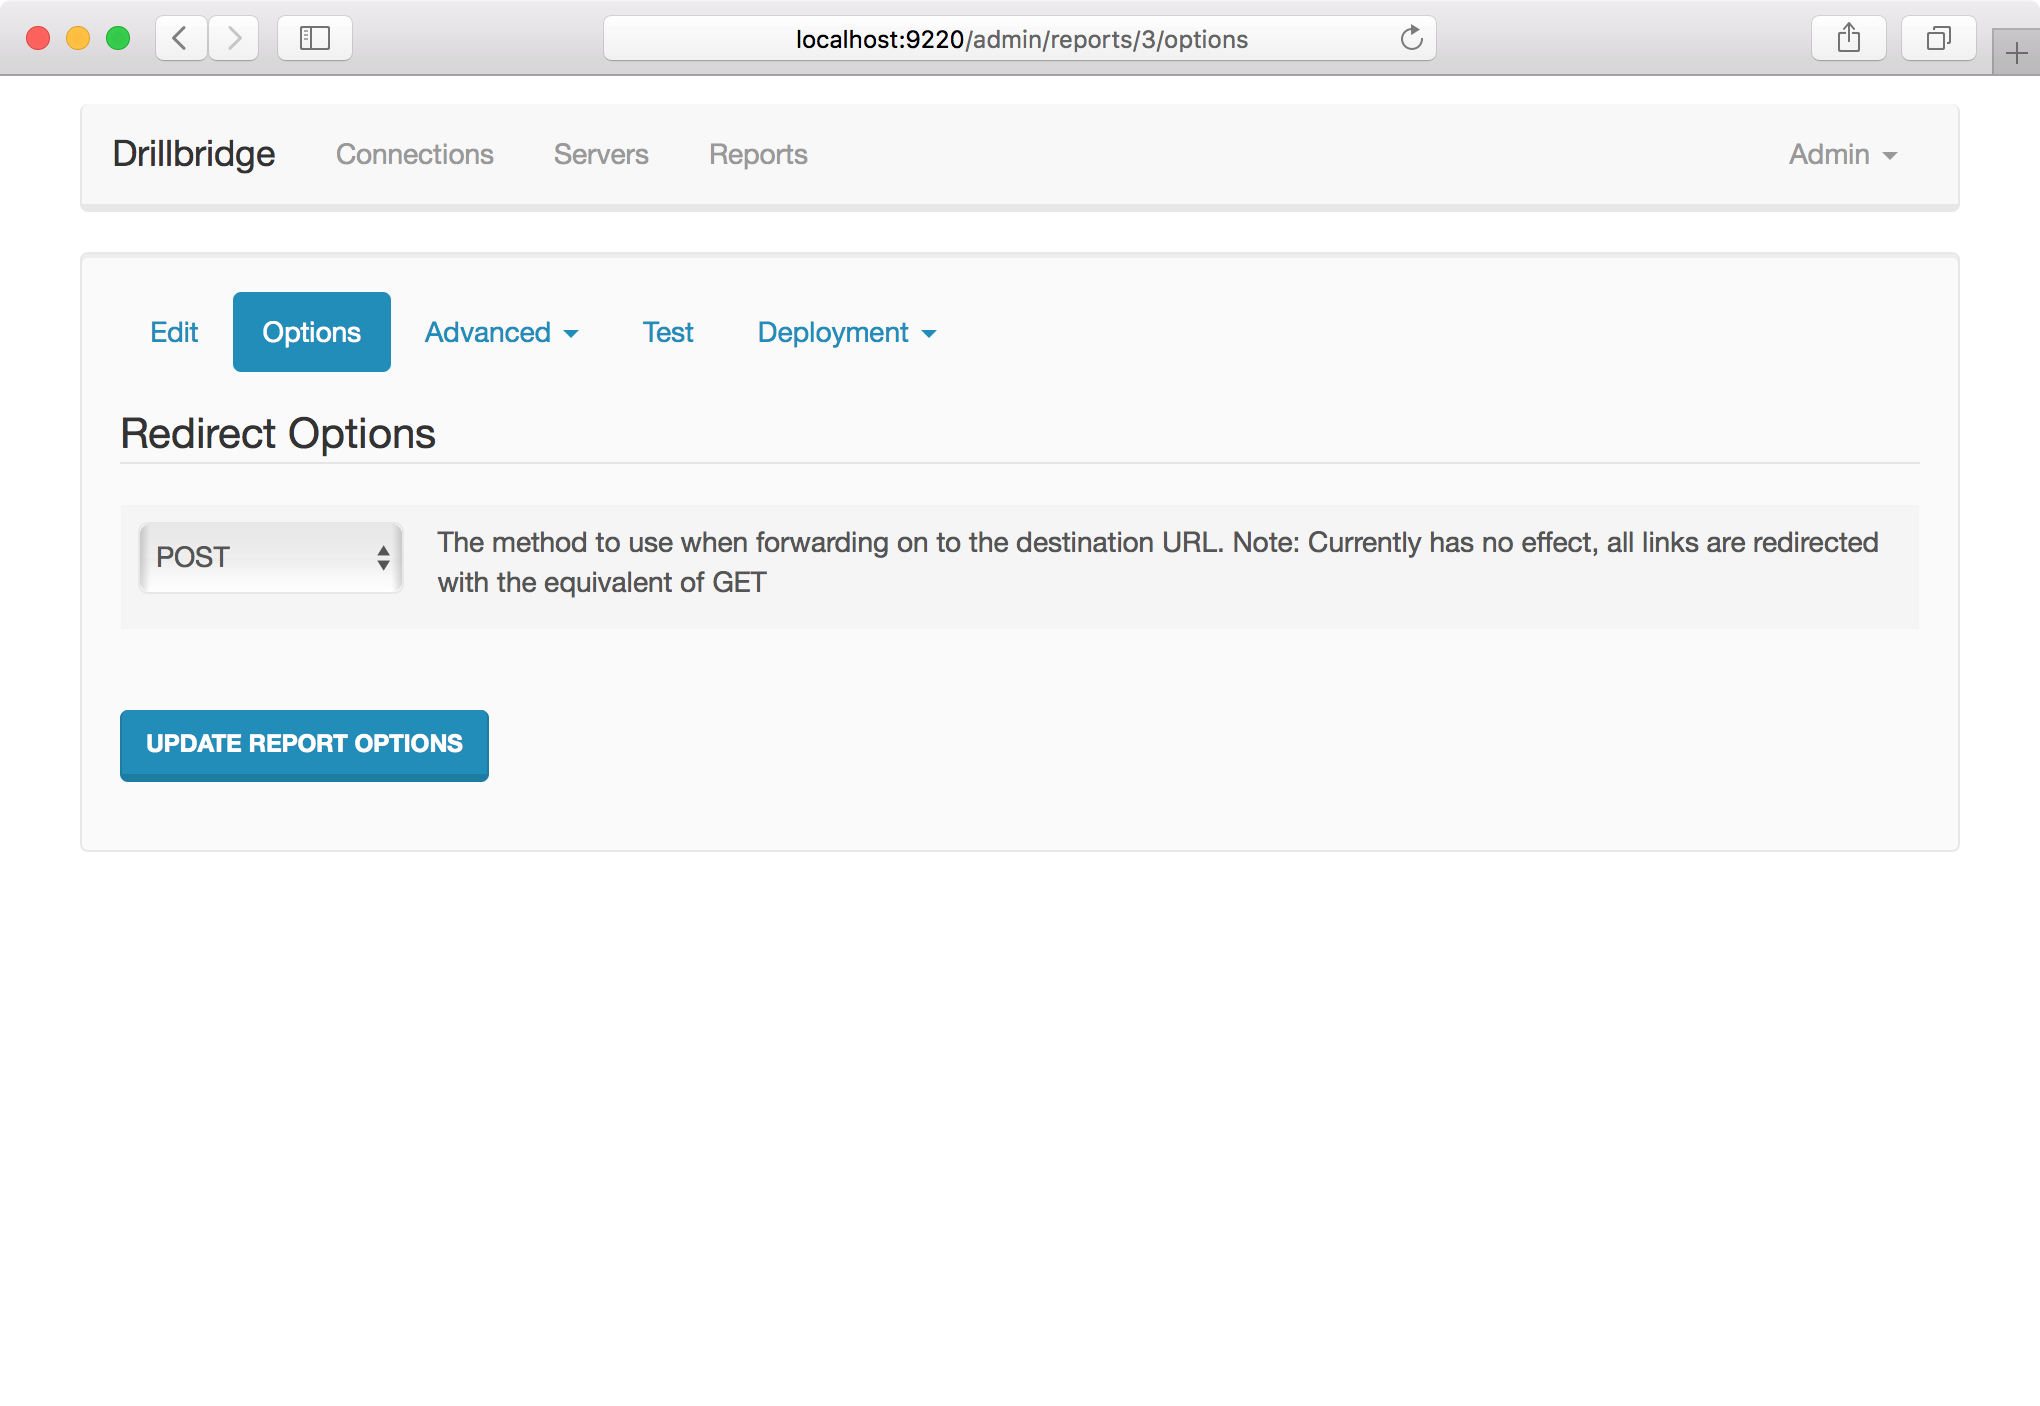
Changing the report type also changes the available options that we have. The Forwarding Link report is a little simpler in terms of its options, but it lets us specify if we want the link to be submitted as a GET or a POST request:

Modifying options on the URL report type

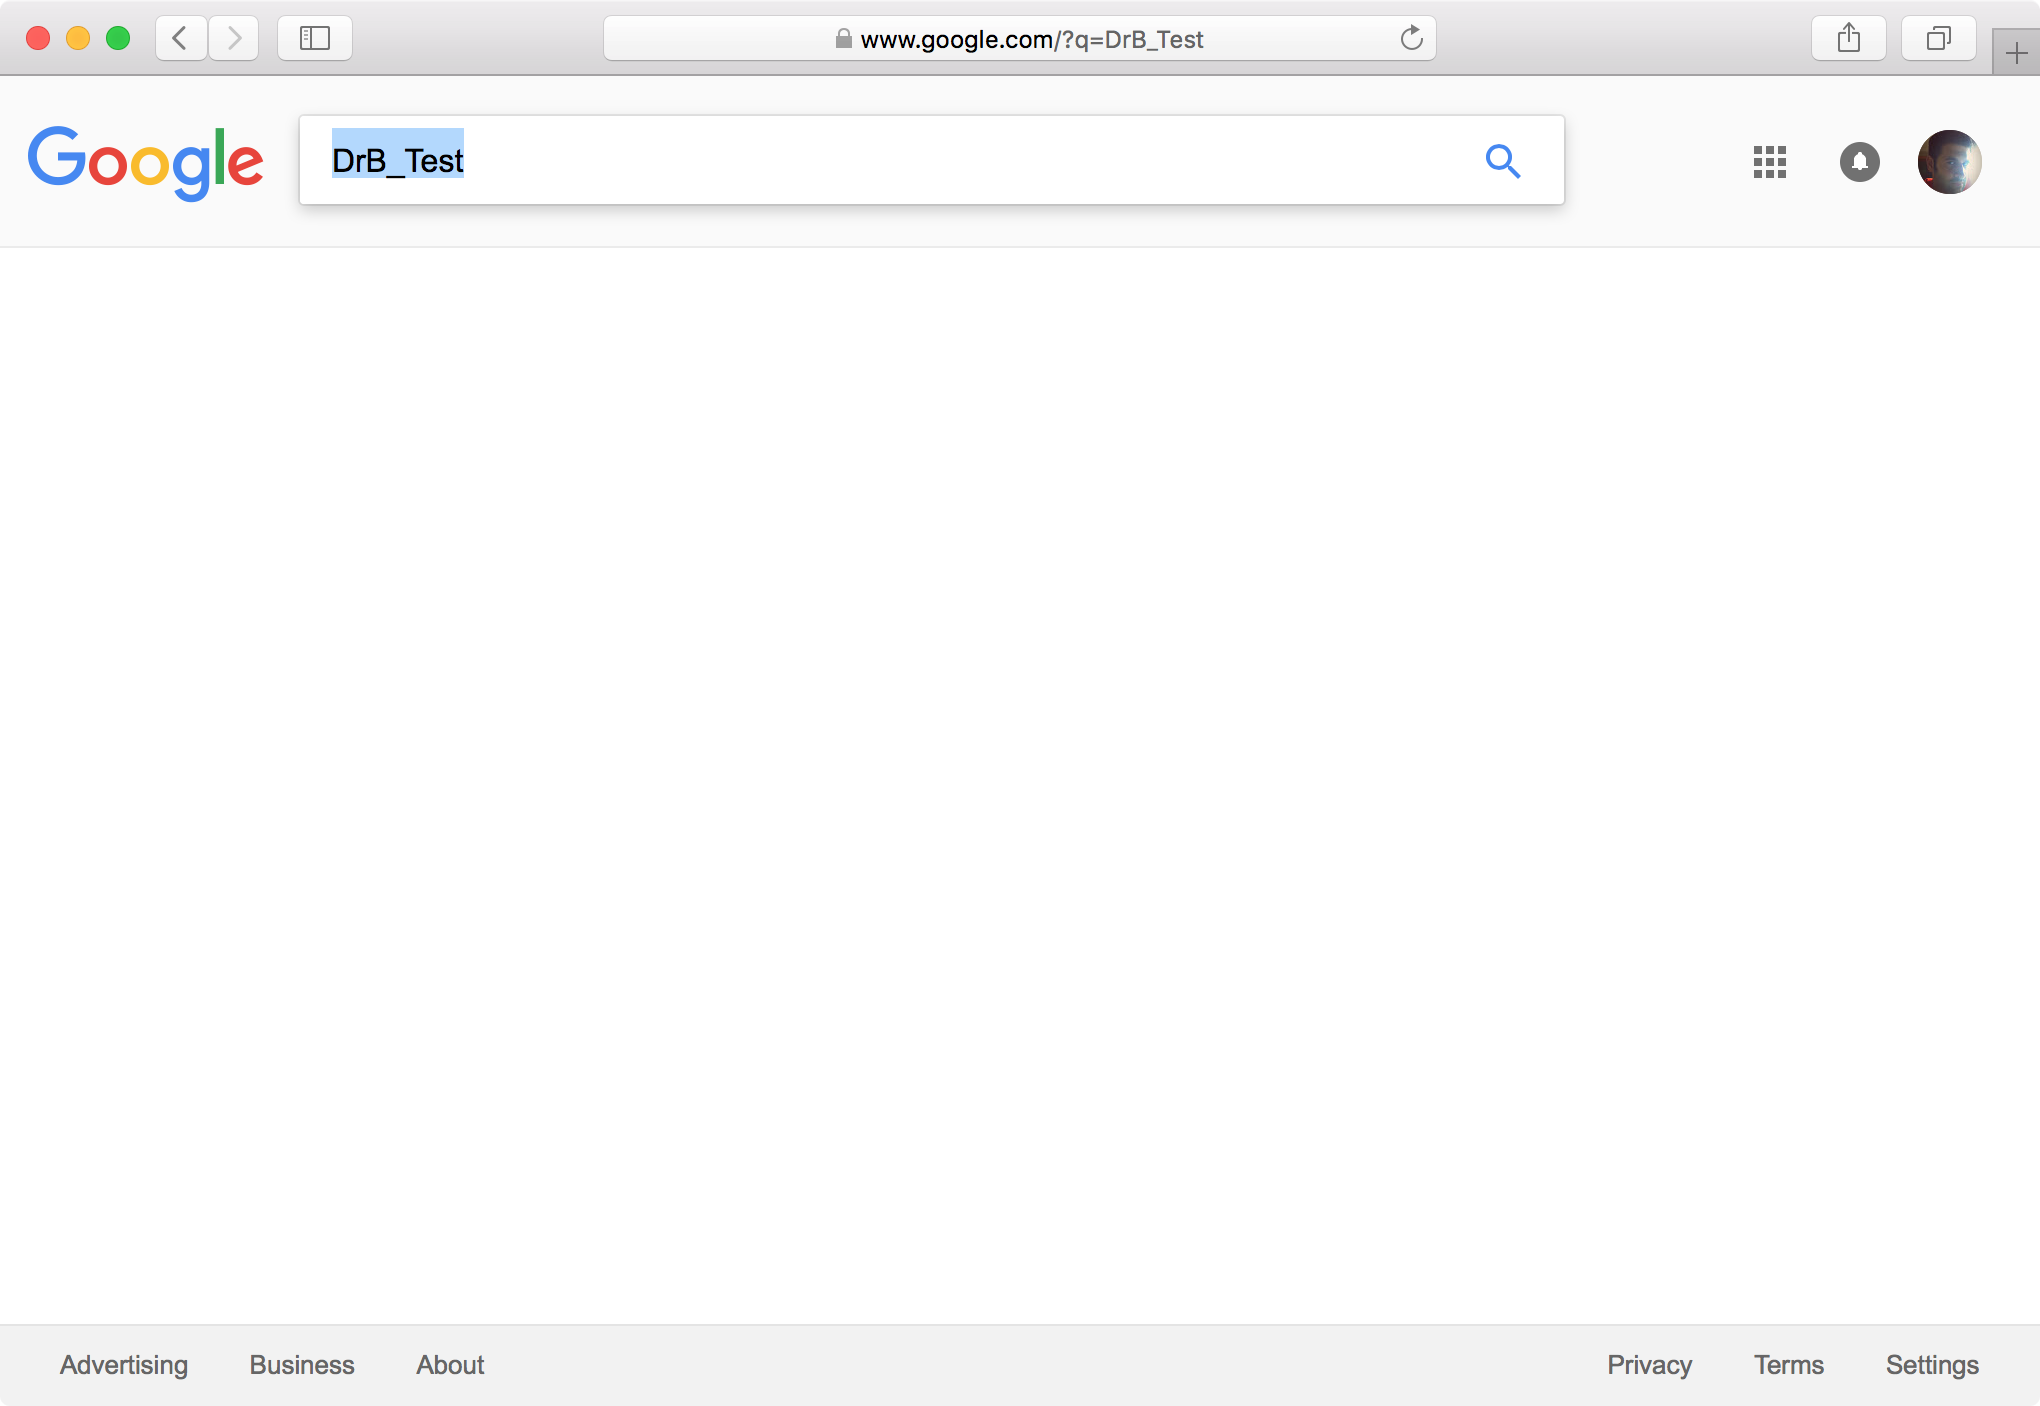
Lastly, after testing this simple report where it submits a search request to Google, take a look at the URL that gets generated and shown in the browser:

Drillbridge URL report

You can see that the parameter I tested (“DrB_Test”) is up in the URL. Many organizations are using this functionality in order to drill into internal systems that show PDFs and images of invoices, receipts

Drill from Upper Level in PBCS

I think this is unique in the world right now, but Drillbridge drill-through from PBCS to on-premise (or cloud) relational databases and supports upper-level drill-through from PBCS. Again, by way of simple example, you can drill into member Qtr1 from PBCS and run a query on-prem that is something like SELECT * FROM Transactions WHERE MONTH_NUM IN ('01', '02', '03). Typically the children of Qtr1 would be Jan, Feb and Mar. This is really easy to convert to a month number using the built-in Drillbridge function #monthToDigits. This function is also really useful because it can handle full month names, different locales (month names in different languages). More importantly, though, is that Drillbridge uses the PBCS REST API to communicate with the cube in the cloud to figure out what those children are.

Essbase Upper Level Drill Ignore Non-Consolidating Option

This is probably a lesser known feature and a small one at that, but it’s a really great example of paying attention to the details. Occasionally you’ll have a hierarchy with some non-consolidating members, such as the following:


Total
    Account1 (+)
    Account2 (+)
    Memo Account (~)

In this case, Account1 and Account2 roll up to the total, but Memo Account does not. It still has data, however, that would be retrieved from running an upper-level drill from the Total member. This may be and often is what you want. However, sometimes it’s better or you really want to ensure that the total from the drilled member matches the total of entries in the drill-through request. So by setting the “~” custom flag on the token, you can tell Drillbridge that when it expands the upper-level member to the list of descendants to query, it should ignore any non-consolidating members. This will ensure that the total you drill on should match up with the sum of the entries. Again, a small feature but it is used out in the real world surprisingly often.

Excluded Members

Similar to the previous option/flag to ignore non-consolidating members, sometimes there are members in the outline that you do not want to drill on at all. Frequently this seems to be sensitive salary/HR data that is fine to show in the aggregate but you may not want people to be able to pull up detailed transactions and find out details. With excluded members, you can set a list of members that should always be removed from the SQL query, even if it would normally be part of the upper-level drill.

Custom Mappings

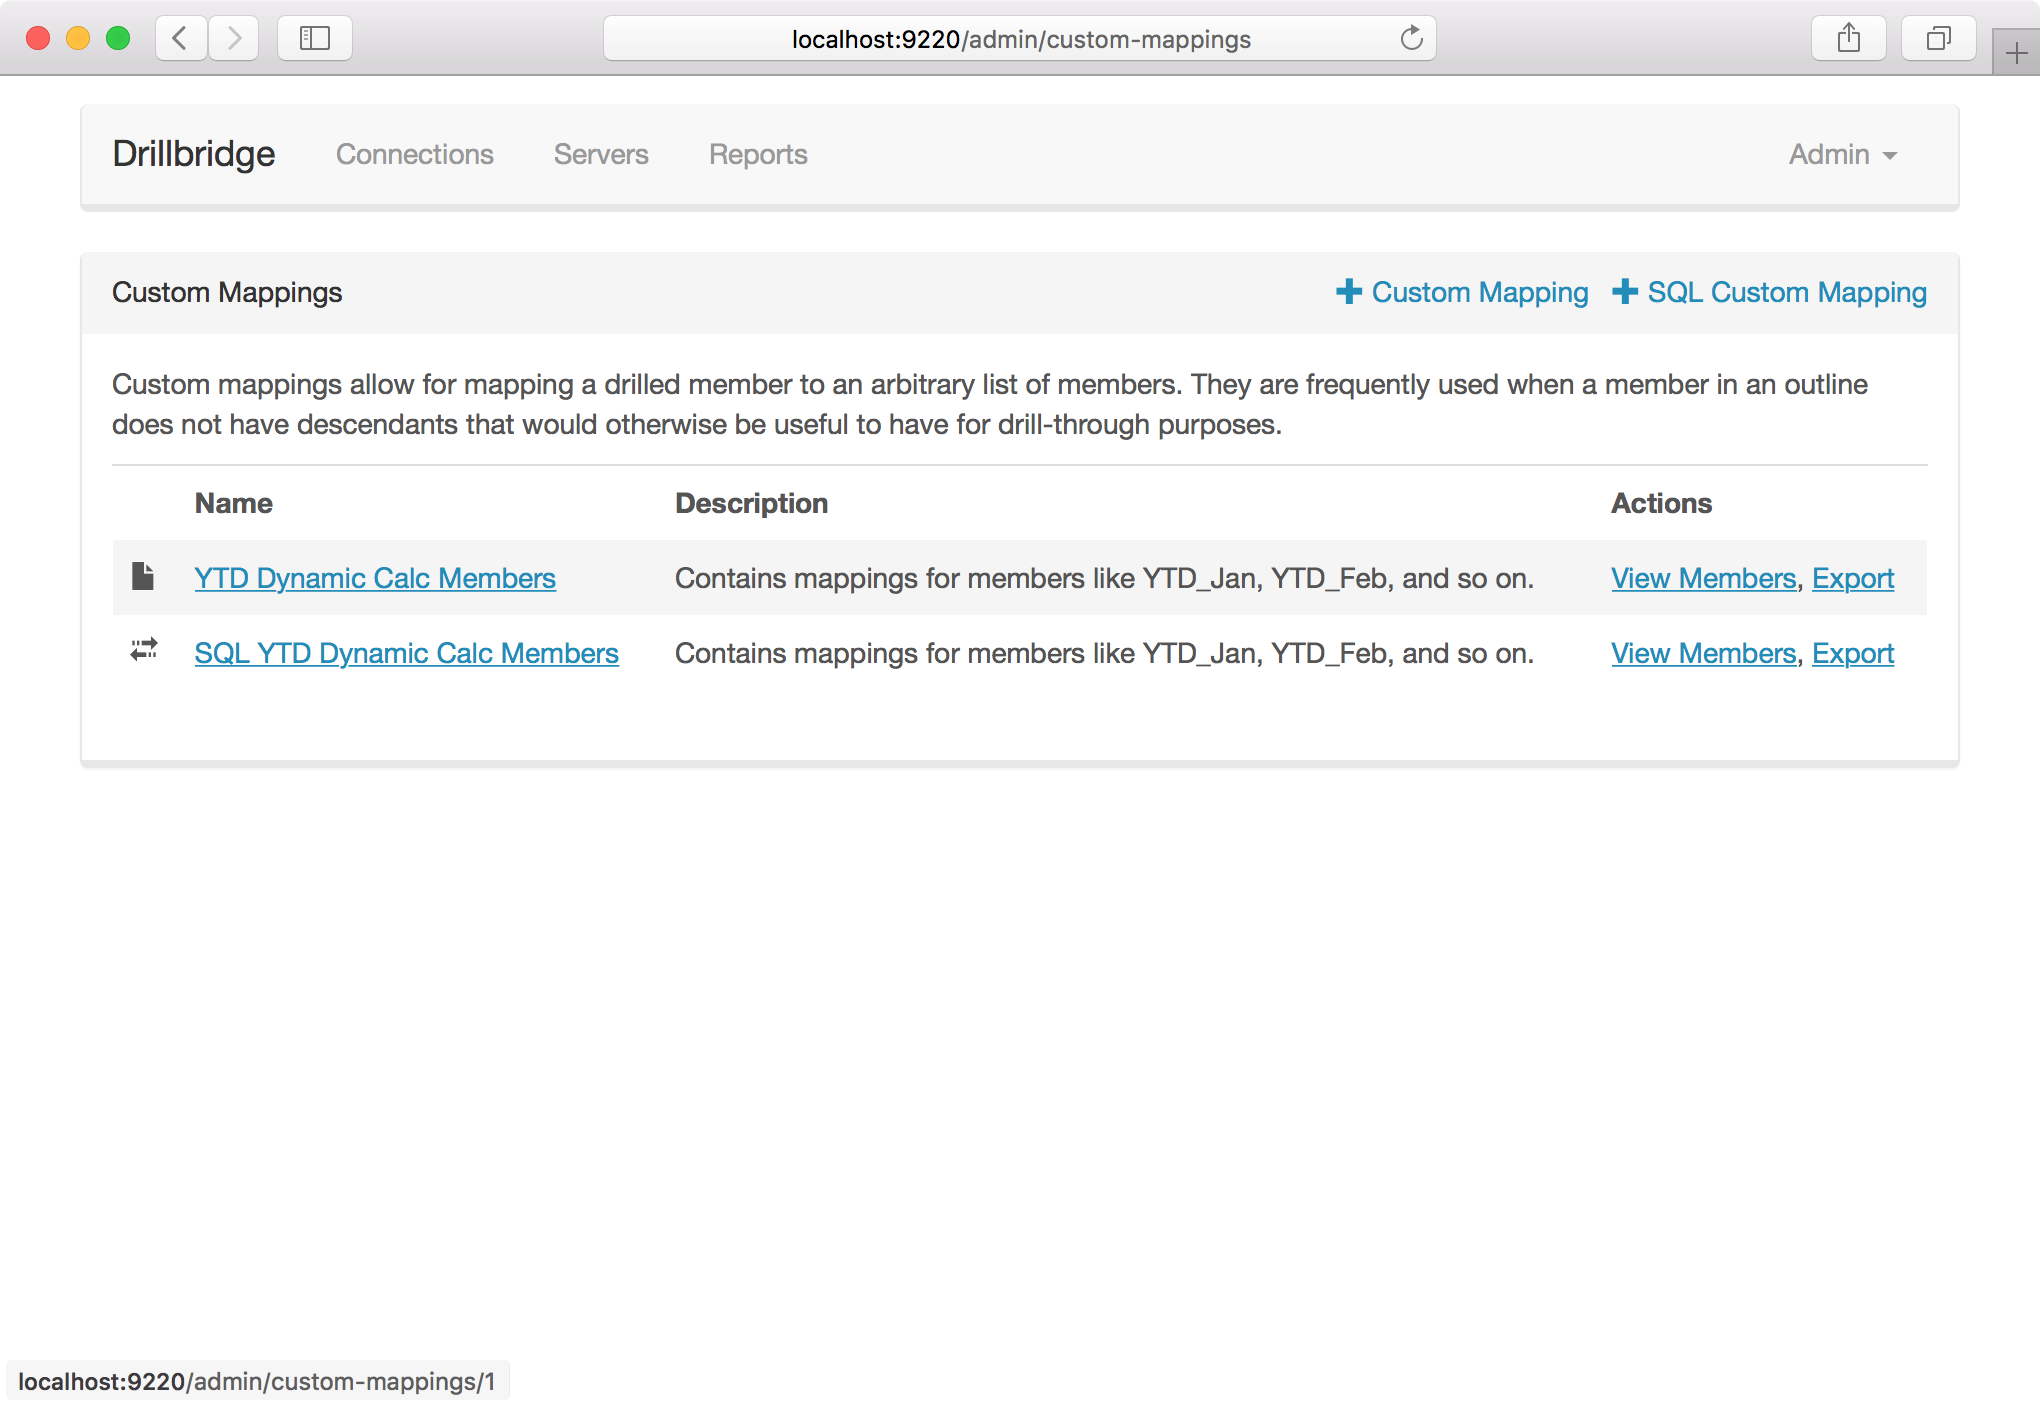
In a way, custom mappings are kind of the opposite of excluded members. They give you the chance to specify a list of arbitrary members in place of an existing member. This is most commonly used for YTD members on ASO cubes. For example, you might have a YTD_Feb member in the Time dimension as part of an alternate hierarchy. There are multiple ways to implement this but it’s common to do with a formula ([Jan] + [Feb] or something). Upper-level drill-through wouldn’t otherwise work here because their aren’t children of this member to provide to the SQL query. This is where custom mappings come in. We can specify via a simple text file or a SQL query that a list of members should be swapped in for a given member. So we can define a mapping such that Drillbridge treats YTD_Feb as if “Jan” and “Feb” were children of YTD_Feb, and perform the query accordingly. This allows for more flexibility in the outline and to provide uniform drill-through experience to the user (as opposed to making them go from the top of the house dimension or manually piece different queries together).

Editing Custom Mappings in Drillbridge

Custom Plugins

Drillbridge supports the ability to add new report types via custom plugins. The report types that Drillbridge ships with (JDBC/SQL, Forwarding Link, MDX, Composite, etc.) are just normal plugins (albeit ones that ship with Drillbridge). Custom plugins are the most interesting and powerful features of Drillbridge, although some custom coding is needed. Plugins are written in Java but have full control over the drill-through experience and output, while also being able to leverage the powerful query processing capabilities and framework built in to Drillbridge.

One of the more interesting uses of custom plugins I have seen in Drillbridge is where companies have an Essbase cube that is based on a GL, but the GL is constantly being updated. This can mean that if you’re drilling from the cube directly to the GL, you can have issues tying out because there may new newer entries throwing the totals off compared to what is in the cube. In this case, the company wanted to be able to see the additional detail though, but not confuse it with what was loaded to the cube. So they built a custom plugin that would color-code the data and put it at the bottom so that the normal data was shown first, then toward the bottom of the report, newer journal entries were shown in a dark grey color that denoted they were newer than what was in the cube. I thought this was a really great use of the custom plugins.

Themes!

The most recent version of Drillbridge Plus comes with the ability to design custom themes as well as a completely new theme called Prophecy. Ever since the earliest versions of Drillbridge it has been possible to modify the HTML/CSS used to render a page, but with the new theme capability, it’s possible to get a different look on your reports with just a single option change. Users of the new Prophecy theme will feel right at home with their other Oracle tools. Here’s a sample image from a normal report with the new theme turned on:

Drillbridge report with Prophecy theme selected

That’s All For Now

I think drill-through has never been more important or useful to users of Essbase/Hyperion products, as it provides very useful and rich context for the OLAP systems organizations spend so much time using. Ever since day one, Drillbridge has tried to do one very specific thing but do it very, very well. I hope you enjoyed this overview of some of my favorite Drillbridge features and welcome your questions and comments!

PBJ (PBCS REST API Library for Java) Updates

I have recently gotten quite a bit of feedback from people using the PBJ library to consume and work with the PBCS REST API. This has resulted in a few fixes and improvements. First of all, file uploads and downloads are now working. The code has been in for awhile but wasn’t merged to the master branch.

Second, I have been working with the very talented Francisco Amores to help integrate the PBJ library with FDMEE so that it can be used there in various integration scenarios. So this is a really cool usage of PBJ where the library is being dropped in to FDMEE/ODI and utilized with a very simple Jython script.

To help with this scenario, I added a new compile option to PBJ that allows it to be packaged up into a single “uber JAR” – meaning a Java JAR file that contains all of its dependencies rolled into a single library. This makes it a little easier to integrate and drop-in to other systems, instead of having to worry out additional JAR files.

We had to make a couple of other tweaks to the way the library is packaged in order to make it specifically work in FDMEE/ODI, due to a conflicting underlying library. This is kind of a classic Java class loader problem, because what happens is that the two different versions of the class are both available to be loaded, and the older version of the class gets loaded but that class doesn’t have a required method, so a “no such method found” exception is thrown. But by renaming the package/method when it’s compiled, we can get around it and make it really simple. The PBJ GitHub page has some more info on how to compile this.

I think in the near future Fransisco will be blogging out this really interesting integration scenario, so stay tuned!

Dodeca Workbook Script documentation available online

I kind of posted this on the down-low earlier this week but got outed by my auto-tweet feature, where it got picked up by Oracle EPM Blogs and a few others, so I thought I should just write about this for real.

Earlier this week, the new documentation for the Dodeca Workbook Script functionality went online. In case you’re not familiar, Workbook Scripts are part of Dodeca Spreadsheet Management System’s event-driven extensibility model. You can kind of think of it as an elegant blend of the best aspects of Microsoft Access macros and Visual Basic, but designed from day 1 to make it easy to facilitate really sophisticated functionality in views that contain Essbase, SQL, or MDX data (or all three on the same sheet!)

The documentation contains a full index, all methods/overloads, events, and functions. It represents one of the first major steps towards my goal of making incredibly high quality documentation and online resources available for people that are developing with Dodeca. In the future I am hoping to get even more documentation online with samples and other resources that make developing even better.

I&#8217;ll be at Collaborate 2017 in Las Vegas, say hello!

Lots of exciting things going on right now – I’ll be in Las Vegas next week for the Collaborate 2017 conference. Originally I was just giving one presentation, but now I have three (yay!). I am going to be presenting on the PBCS REST API and in particular how to use it via the high-quality, open source PBCS REST API Java client, PBJ. I am also going too be presenting on “Essbase Tools & Toys” – a whirlwind overview of some of the free tools that make Essbase better that I have created over the years (including Drillbridge, Cubedata, Vess, Camshaft, Thriller, and more), and on the Dodeca Spreadsheet Management System.

Additionally, Applied OLAP will have a booth in the Hyperion section of the exhibit hall, which is where I’ll ostensibly be when I’m not doing presentations. Please swing by and say hello!

Handy Essbase Data Audit Log Query for Dodeca Repository

I’m putting together a simple Dodeca view that shows information from Dodeca’s data audit log tables. One of Dodeca’s really nice Essbase-specific functionalities is that it logs all user inputted changes to Essbase data. This comes in handy for many organizations so they are able to tell when something changed, what changed, who changed it, and what the old value is. Because the same tables are used for every single cube in the system and every cube can have different dimensionality, Dodeca uses a flexible table structure to record all of the dimension names and members that changed. A naive query against these tables will give you multiple rows for the same data point (one for each member in the POV), but I wanted something quick and easy to consolidate to a single row per data item changed.

Most of my own Dodeca servers use MySQL for the repository database (although it’s common to use SQL Server, Oracle, DB2, and others). I discovered a really great MySQL-specific function called GROUP_CONCAT that is able to join fields from multiple rows, and it works great. Here’s my Data Audit Log query:


SELECT 
    AUDITLOG.SERVER,
    AUDITLOG.APPLICATION,
    AUDITLOG.CUBE,
    AUDITLOG.USER_ID,
    AUDITLOG.CREATED_DATE,
    GROUP_CONCAT(DP.MEMBER SEPARATOR ', ') AS MEMBER_NAMES,
    GROUP_CONCAT(DP.ALIAS SEPARATOR ', ') AS ALIASES,
    IFNULL(ITEMS.OLD_VALUE, '#Missing') AS OLD_VALUE,
    ITEMS.NEW_VALUE
FROM 
    DATA_AUDIT_LOG_DATAPOINTS DP, 
    DATA_AUDIT_LOG_ITEMS ITEMS, 
    DATA_AUDIT_LOG AUDITLOG
WHERE 
    DP.AUDIT_LOG_ITEM_NUMBER = ITEMS.AUDIT_LOG_ITEM_NUMBER AND
    ITEMS.AUDIT_LOG_RECORD_NUMBER = AUDITLOG.AUDIT_LOG_RECORD_NUMBER
GROUP BY
    ITEMS.AUDIT_LOG_ITEM_NUMBER
ORDER BY
    CREATED_DATE DESC

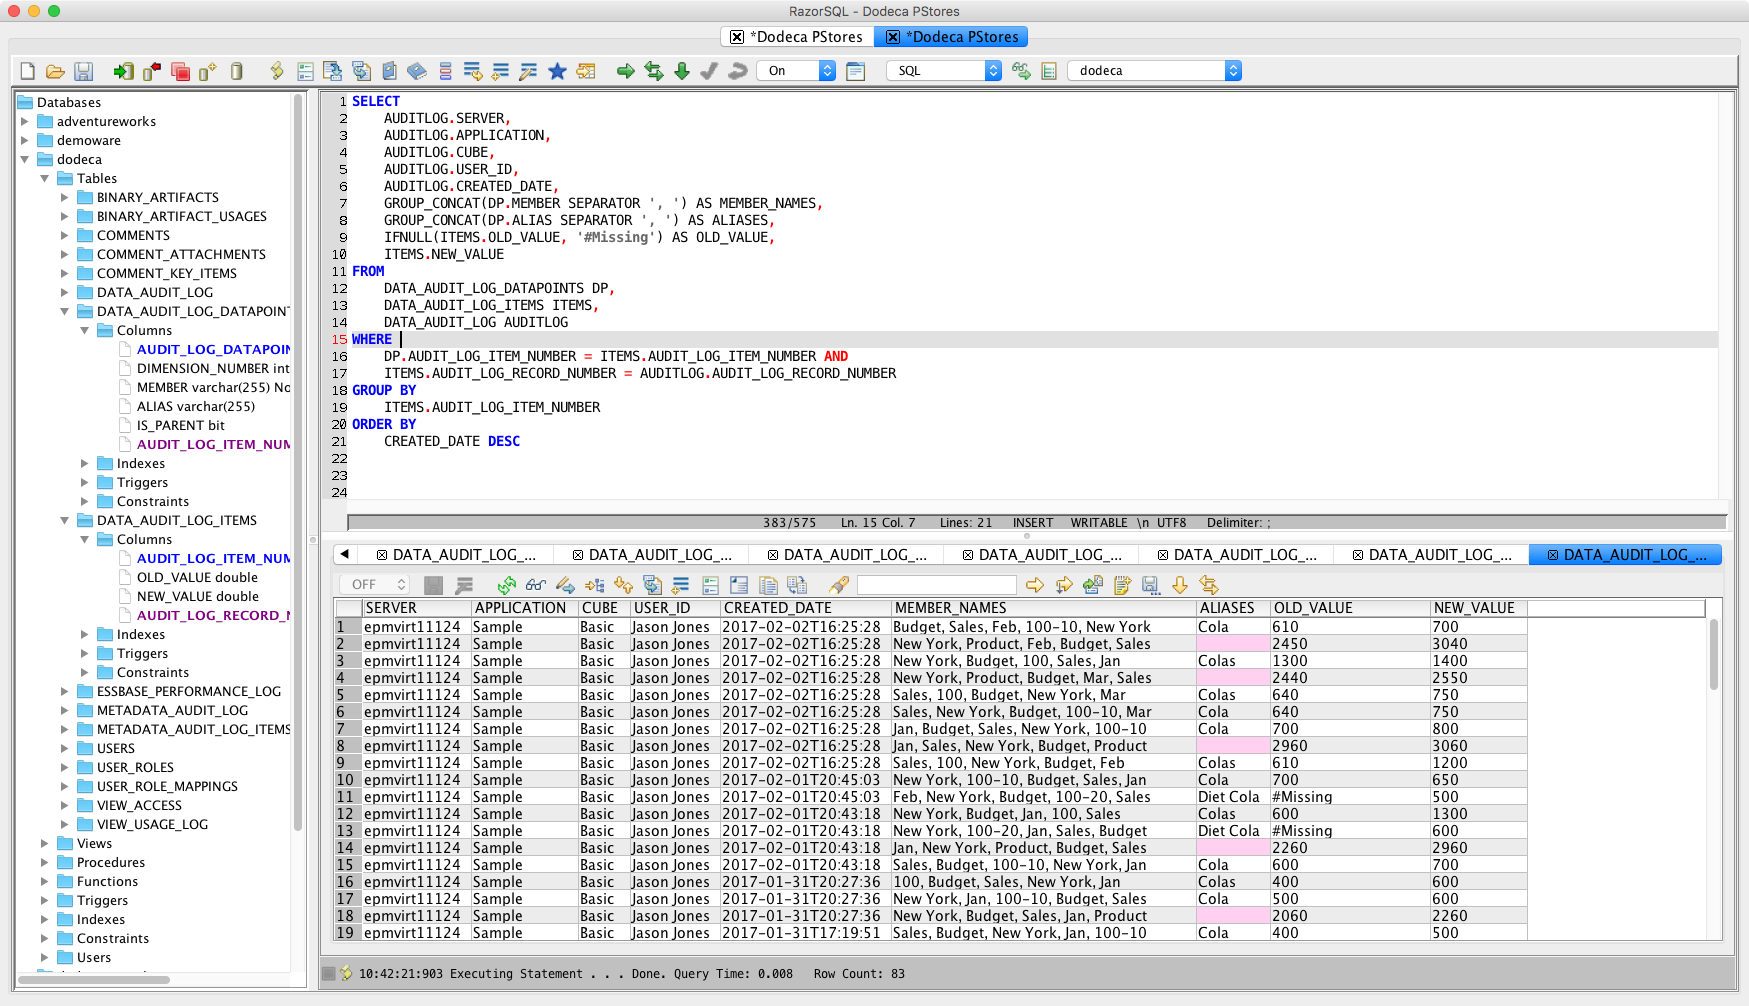
And here’s a view from a SQL tool:

A query for viewing Dodeca’s data audit log tables for Essbase data

I went ahead and used the concatenation function twice – once for the regular member names, and again for the aliases. Not every member of every intersection has an alias, but fortunately the function handles it just fine. So now I have everything on one line exactly like I wanted.

Jazz Up Those Static Dodeca Views With Advanced Essbase Features

Oftentimes when I am demonstrating or teaching aspects of Dodeca to people, they are amazed at the sheer number of options and configurations that are available on a view. Fortunately, I am able to tell them that yes, there are many, many options – and they are there if you need or want them, but they won’t get in your way. The defaults are very sensible and getting a basic Essbase-based Dodeca view running is incredibly easy.

Another thing to keep in mind is that for the most part, the extreme amount of options and flexibility we have on a single view is often available to us in lieu of code. So, tasks that typically required some non-trivial amount of VBA code are now completely code free. When we need some advanced functionality that isn’t available out of the box, we can use Workbook Scripts, which is an event-driven scripting technology that is particularly well suited to working with spreadsheets and the data contained in them.

That all said, today I want to walk through a bit of a cross-functional example that starts with a very typical Dodeca view based on an Essbase retrieve range, then enhance it to give our users the ability to zoom in on the different time periods in the view without having to rebuild the view. So we’re going to blur the line a bit between static and dynamic reports, and our users are going to enjoy some additional flexibility and convenience with regard to their reporting (and keeping users happy is always a good thing, right?).

Imagine the following fairly typical view based on Essbase data:
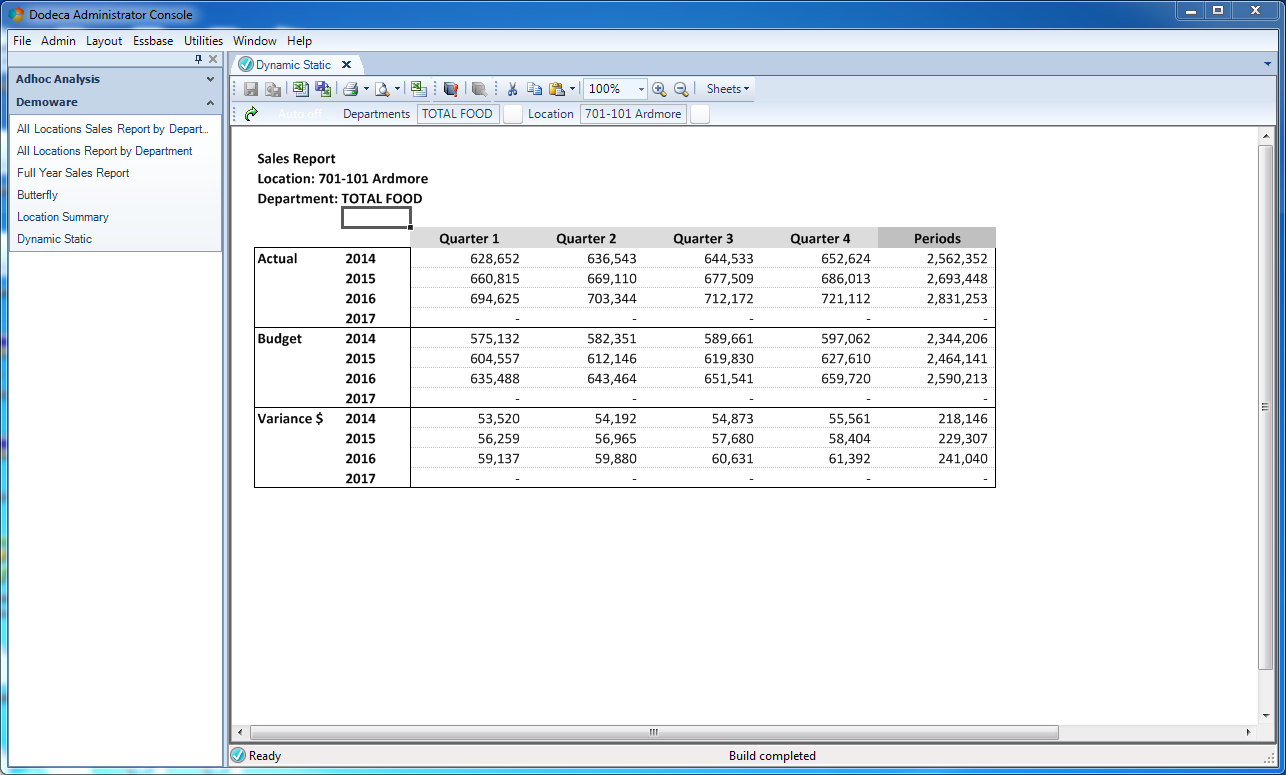
A fairly typical Dodeca Essbase view built around a single retrieve and some light formatting

In the preceding screenshot, you can see that we have a single retrieve range from Essbase with Scenario, Years, and Time on the axes. As with many views in Dodeca, since we can put the retrieve(s) anywhere we want and add convenience formatting, we have the report title, location, and selected department in the upper left corner.

Also note that the row and column headers and gridlines have been turned off. This is easily accomplished via setting a couple of options on the view configuration. For reports like this where the headers don’t really add much, it can really clean things up.

To get a sense of what the Dodeca template looks like, however, let’s go to the view template designer and turn on row and column headers and unhide any hidden rows:
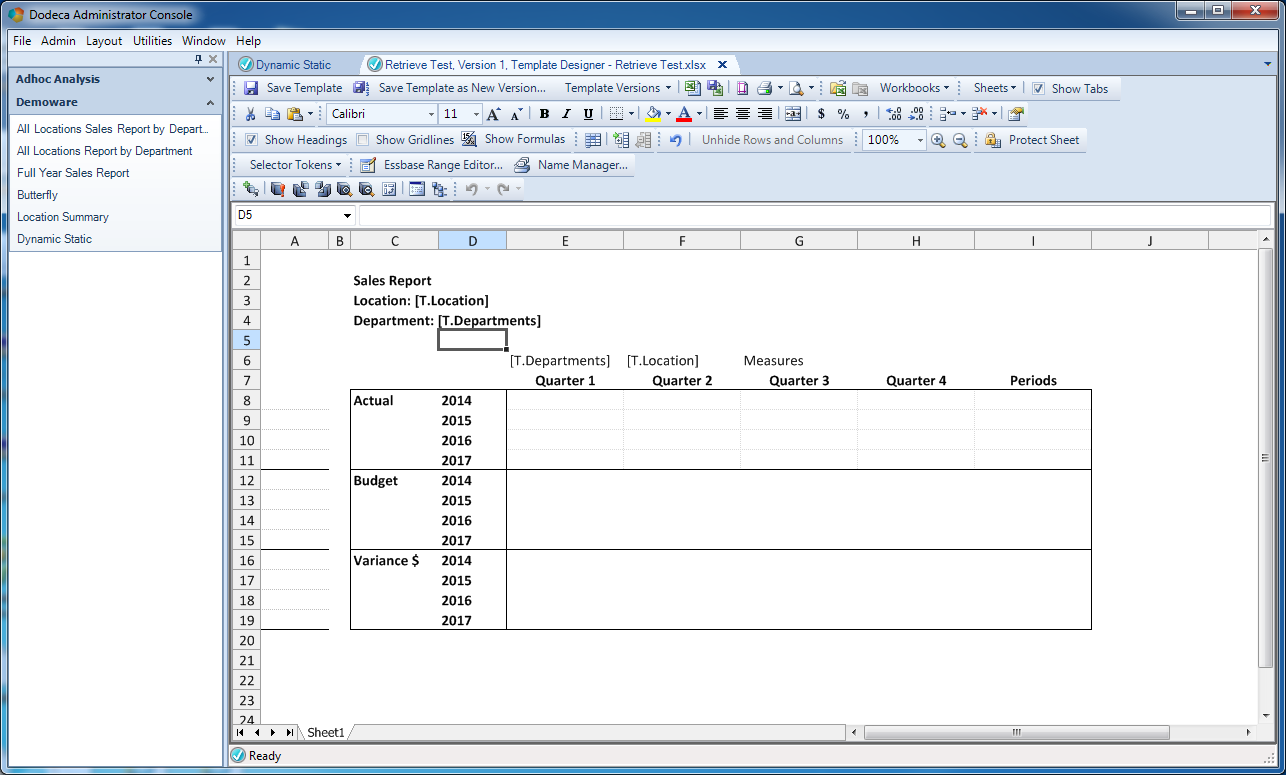
The template for the view, with rows/columns unhidden

Things are a little more interesting here. Notice that column A is a “template column” that was previously hidden, and row 6 was also previously hidden. This is a very typical technique where the contents of the row are needed to perform the Essbase retrieve, but we don’t actually want to show them.

Template Columns & Template Rows

I’ll get to the notion of template columns and template rows in more depth later in this article, but as a brief aside, I want to explain where we’re headed and what’s going on. As the name might suggest, a template column (or row) is often used as a prototype for copy and paste or other grid expansion operations, particularly when there is a dynamic number of rows to be built. Several facilities in Dodeca can be configured to look to a template, such as a defined range with an arbitrary number of cells, and essentially copy it for new rows/columns that are being generated. This allows us to easily style up dynamic content with the exact style, cell formulae, spacing, and other attributes that we want, without having to resort to code or other shenanigans.

Templates are not limited to a single row/column, either. They are frequently wider/longer, allowing us to easily generate dynamic ranges with complex formulae and other features. In this case we are just going to use a single column as the template.

The last thing I want to point out about row and column templates is that you will often find them above or to the left of the content that is going to dynamically grow. For example, in the grid above, the content is going to possibly grow to include more columns, so I have the column template to the left of all of that. This makes my life a little easier since I know that the location of the column template isn’t going to move around on me. Because rows and columns that we hide on the view template will stay hidden (but are still completely functional), I can just hide the template and not have to worry about it.

Now Back to Our Template Layout

Just to make things clear about the Essbase retrieve range, here it is exactly on the template (Note the defined name of Ess.Retrieve.Range.1):
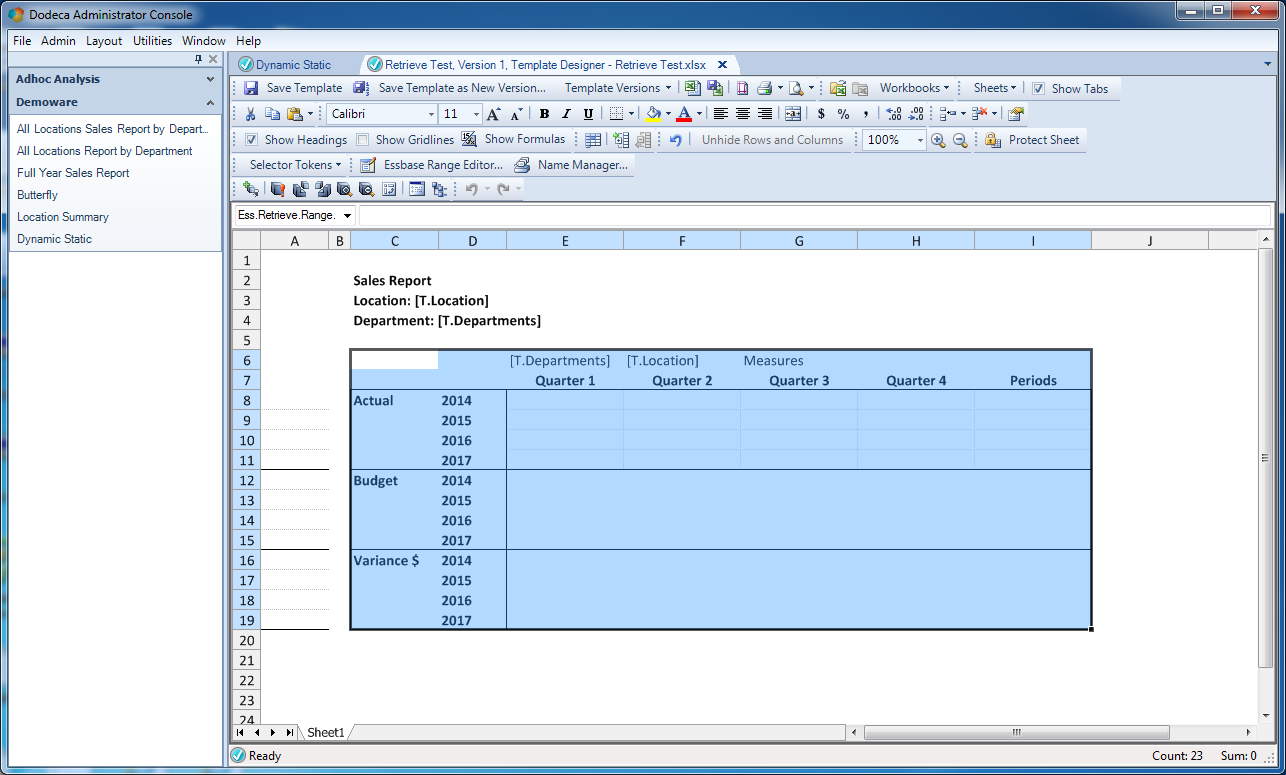
The retrieve range for the template highlighted

Again, the top row with the POV members is going to be hidden because we are going to format those more nicely in the upper left. Our column template also gets a name and defined area:
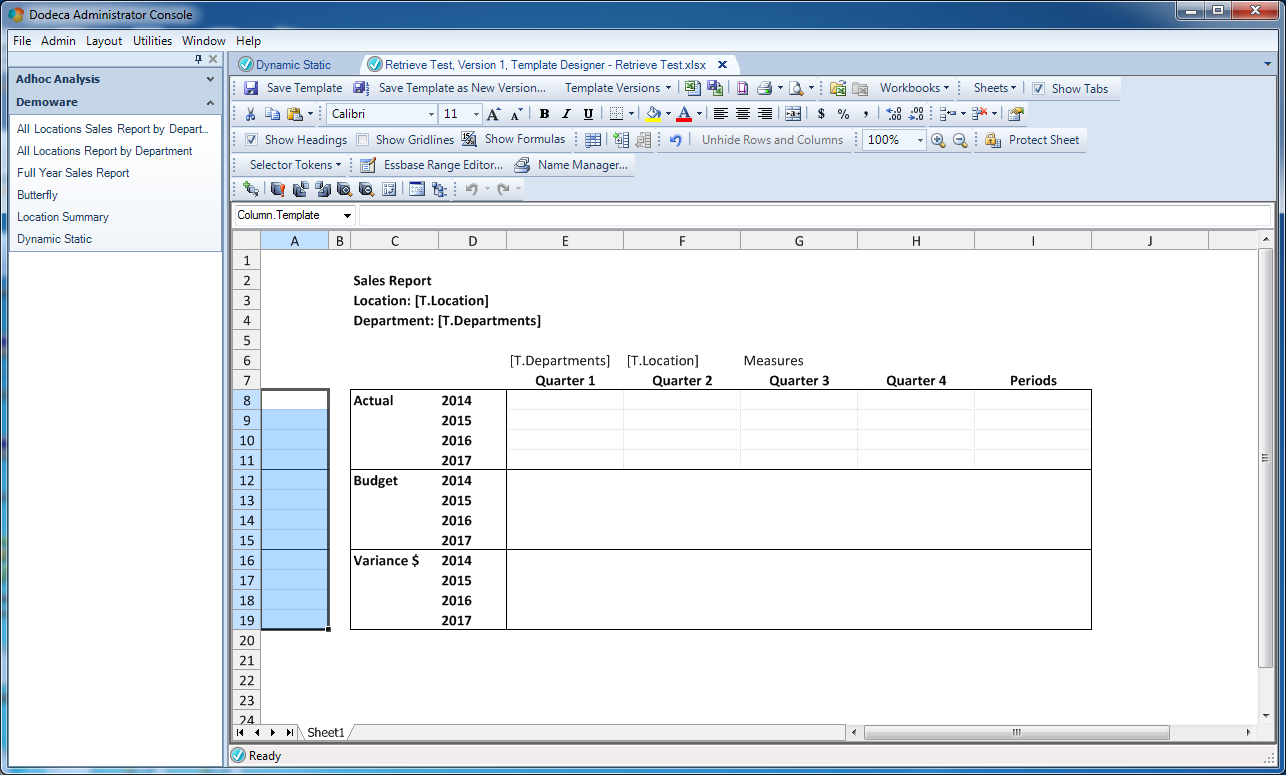
A range (Column.Template) that will be used for formatting columns

The column template isn’t going to have Essbase data retrieved directly in to it, as you’ll see later, it’s purely for formatting purposes. Notice that it also has a defined name of Column.Template (so that we can refer to it easily in Workbook Scripts and other places that might need it).

That’s actually just about all we need for the view template itself. The rest of what we need to configure is the view properties and a workbook script to help with some of the dynamic formatting that we want.

There are a few options that we’re gong to use on this report that I haven’t talked about before, but are going to come in very handy. Check out the options I’m using in my Behavior – Essbase category:
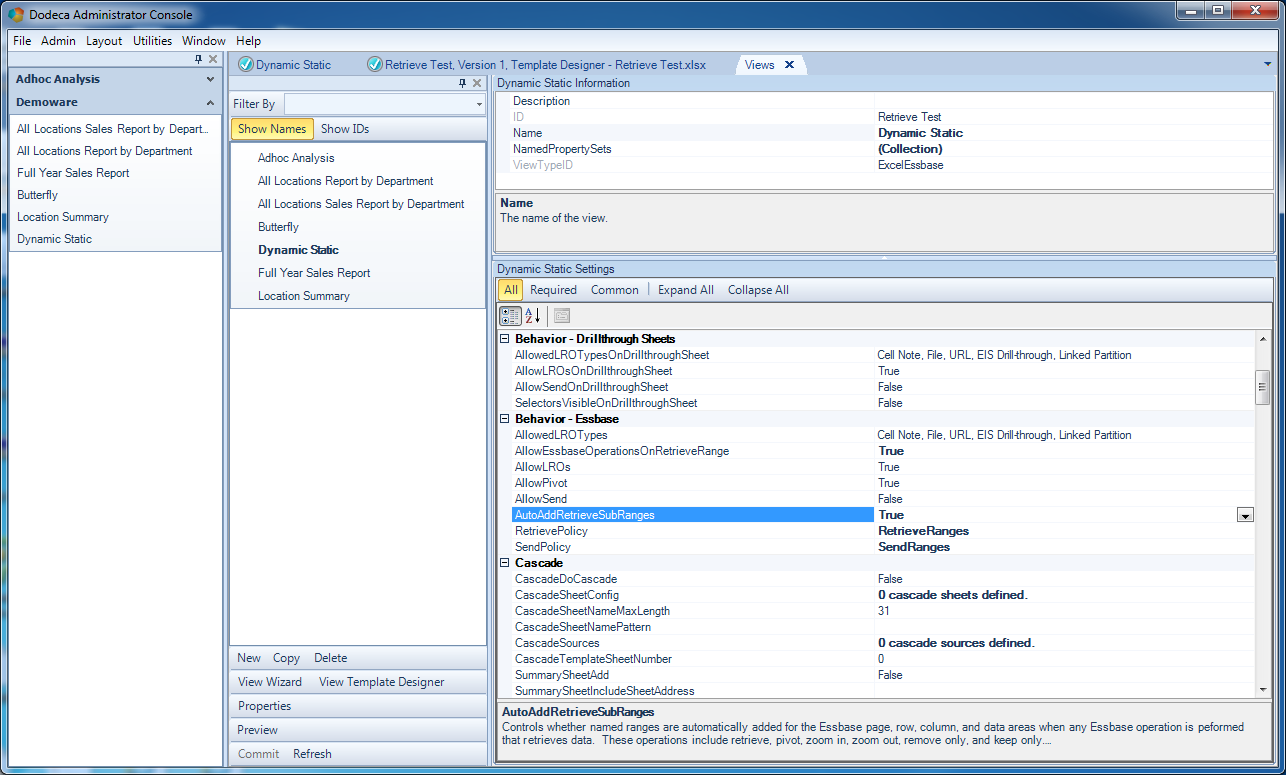
Special options that we will look at: AllowEssbaseOperationsOnRetrieveRange and AutoAddRetrieveSubRanges

Of note, I have AllowEssbaseOperationsOnRetrieveRange set to True and AutoAddRetrieveSubRanges also set to True. The first option is where I can tell Dodeca that yes, I want users to be able to interact with a given Essbase grid on the build view. By default this is off (we’re turning this on so that users can double click on a time period to expand out to the children time periods on the built view. I just need a couple of other options set to round things out:
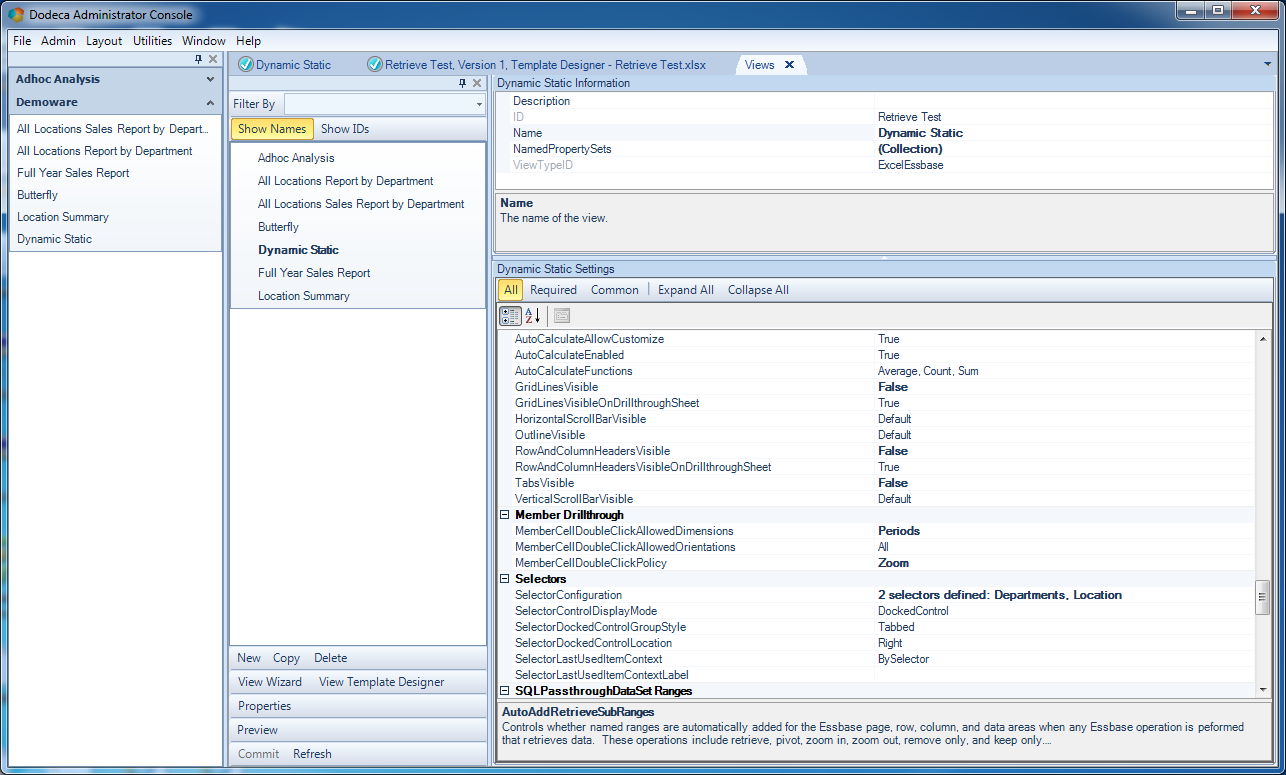
Additional options for Member Drillthrough (note allowed dimensions and cell double click policy)

Besides some of the UI things I set, the main options to note are the Member Drillthrough options. This is where I can configure the exact behavior for double clicking on a member on the grid. Nicely enough, I can even specify the exact dimensions that a member can drill into. Because I only want to let the Periods dimension be expandable (and not others), I simply specify that dimension name here and now the user will only be able to expand that dimension.

Our New Best Friend, AutoAddRetrieveSubRanges

Next, let’s talk about this AutoAddRetrieveSubRanges option. This is a really, really fantastic option because of all the amazing utility and convenience it can provide to us. What this option does, is that when it’s set, Dodeca will retrieve Essbase data, and then automatically create new subranges (defined names) within the overall retrieve range that outline exactly where the rows, columns, POV dimensions, and data reside.

Whoa.

Think about this for a minute. This is particularly poignant in the context of what I might call “Configuration over code”. Let’s say that we weren’t using Dodeca for this report. Let’s say that we had an Excel book that we wanted to automate with some VBA. So we write some code to connect, cycle through a range, retrieve from Essbase, format the data, put it in the right cells, clean up the connection, and more. Then maybe we need to write some more code to figure out which axis is which (row/column/POV/data). That’s a lot of code to write. That’s an insane amount of code to write considering that we can have this behavior out of the box with a couple of checkboxes in Dodeca. Just to hammer this home, let’s take a look at the effect of turning this option on for a typical Essbase retrieve.

There are four ranges that are going to be added automatically to the view when it is built. Here’s the range that gets created automatically for the POV members:
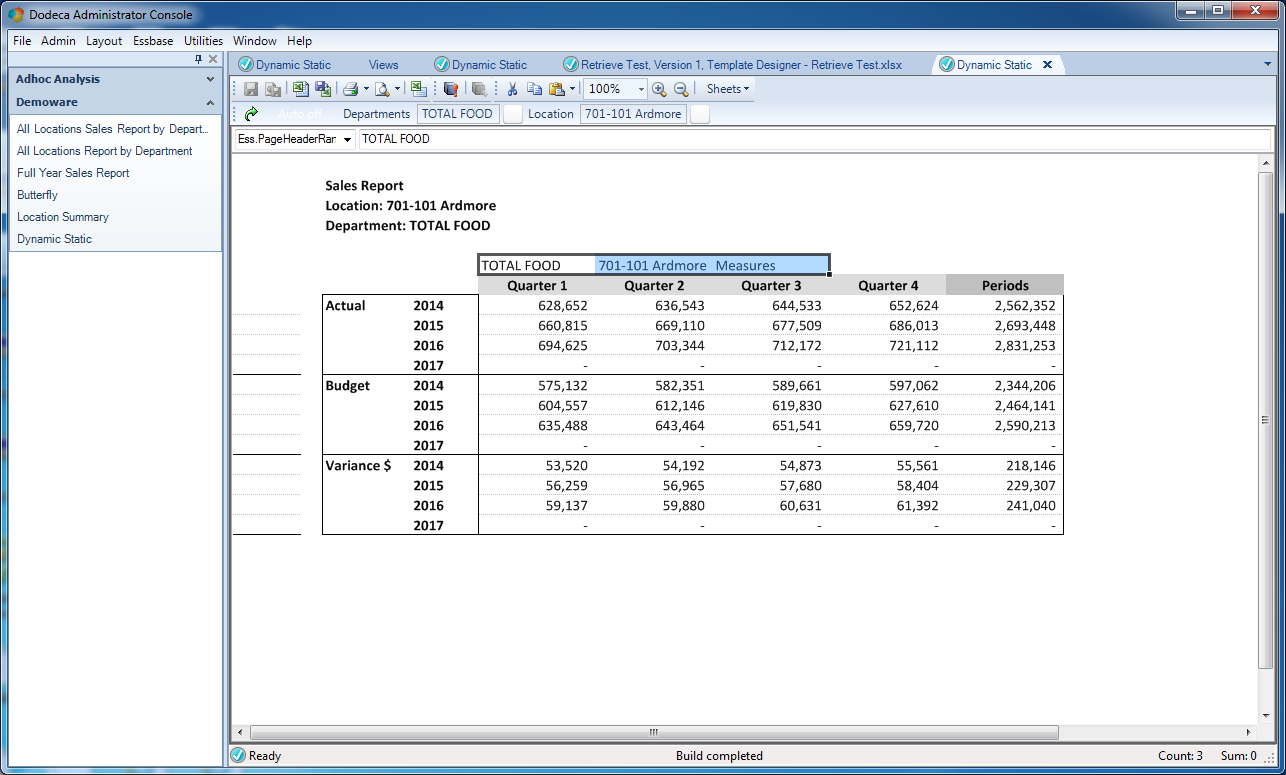
The effect of auto add sub ranges (Page Header)

And for the column headers:
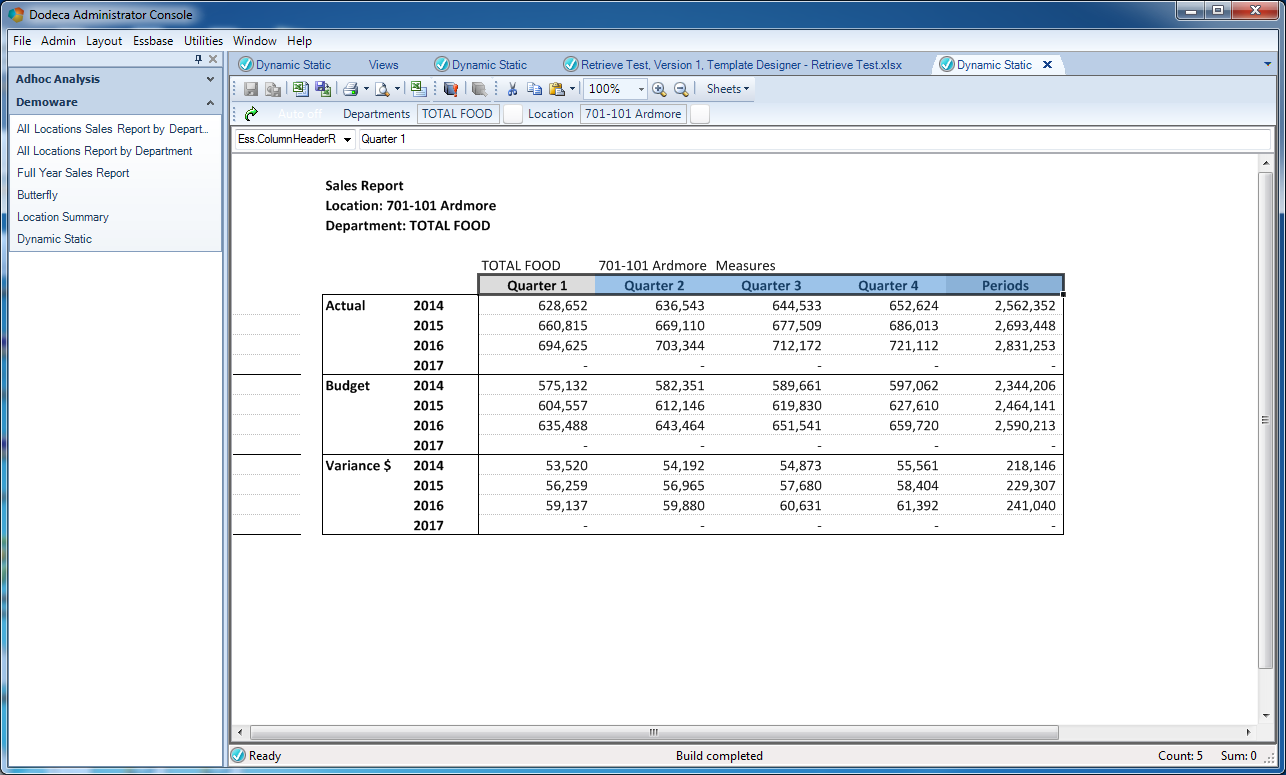
The effect of auto add sub ranges (Column Header)

And for the row headers:
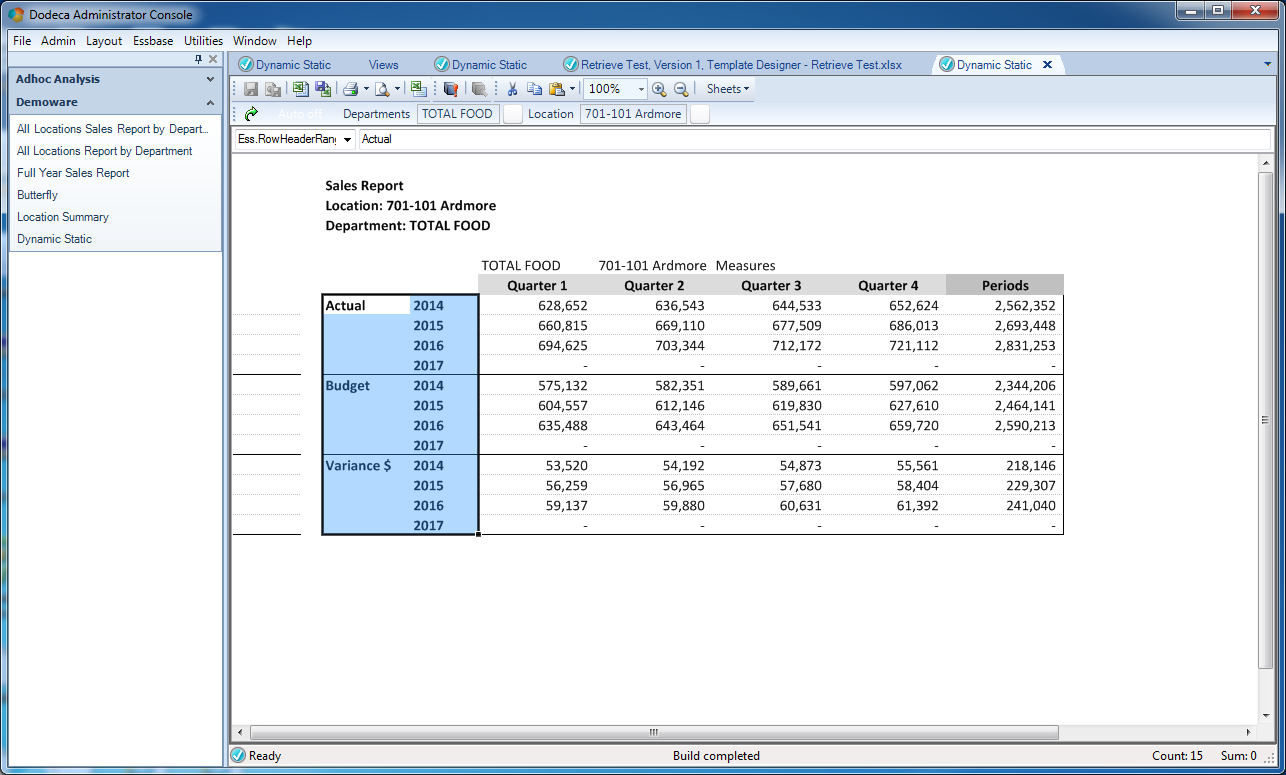
The effect of auto add sub ranges (Row Header)

And for the data itself:
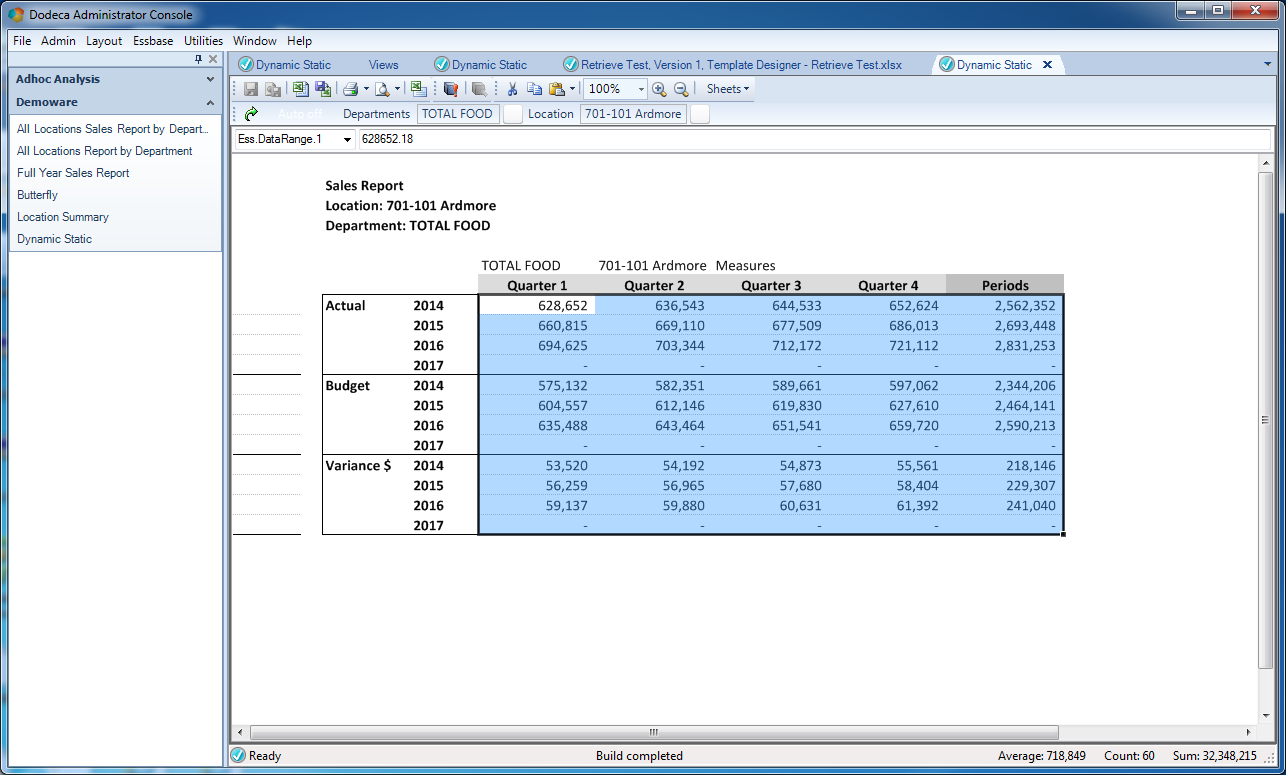
The effect of auto add sub ranges (Data Range)

Before getting in to the workbook script that is going to tie this all together, I want to show the look we are going for. The report will nominally built to show quarters and the full year value, but we want the user to be able to double click on a quarter and expand the report out (via a quick retrieve to Essbase) to the the months in that quarter – all without having to rebuild the view itself. Double-clicking on Quarter 1 should make the report look like this:
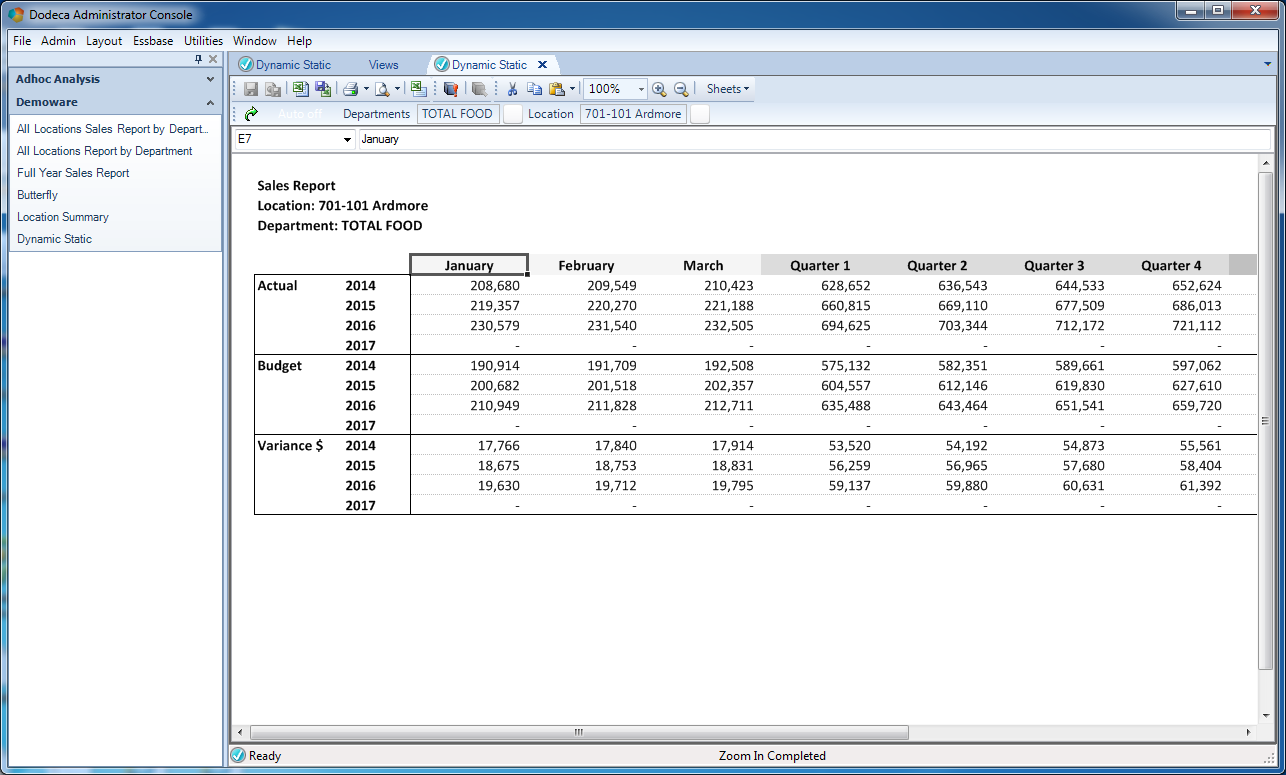
Result after double clicking on Qt1 (children are shown)

A Little Workbook Script to Tie It All Together

You might be wondering why the automatically generated range names were so important earlier. Well, it has to do with the workbook script that we are adding to this view. You see, one thing that we need to define for ourselves for this blend of static/dynamic view is how the newly drilled members should be formatted. And as it turns out, my requirements for this report are that the color of a header column should be different depending on whether it is a period/month, quarter, or the whole year.

Workbook scripts (WBS) are event driven groups of actions that can be added to a view. In many ways, they are to Dodeca what VBA is to Excel. That said, they are also meant to be more powerful, flexible and maintainable.

In the world of Essbase and Excel programming, there are very many actions and activities that revolve around iterating through rows and columns of cells. Sometimes these activities need to operate on a whole range, sometimes on every individual cell, sometimes it depends. It’s these types of activities where WBS really shine and our automatic named ranges are going to come into play.

As it turns out, the list of columns that we need to dynamically format using the WBS exactly coincides with the column headers range that was automatically added to the Essbase retrieve range.

What I’m going to do now is step through the entire configuration of the workbook script so you get a sense of how they work and some of the features they offer.

Properties

Remember that I wanted to have different colors depending on the level of the time period? Let’s setup properties on the WBS so I can easily configure these. Every WBS can have its own properties, which are basically like constant variables (in the world of programming). In the following screenshot, in the Properties section of the WBS, you can see that I have defined three different properties (ColorLevel0, ColorLevel1, ColorLevel2) and defined them with a particular color each:
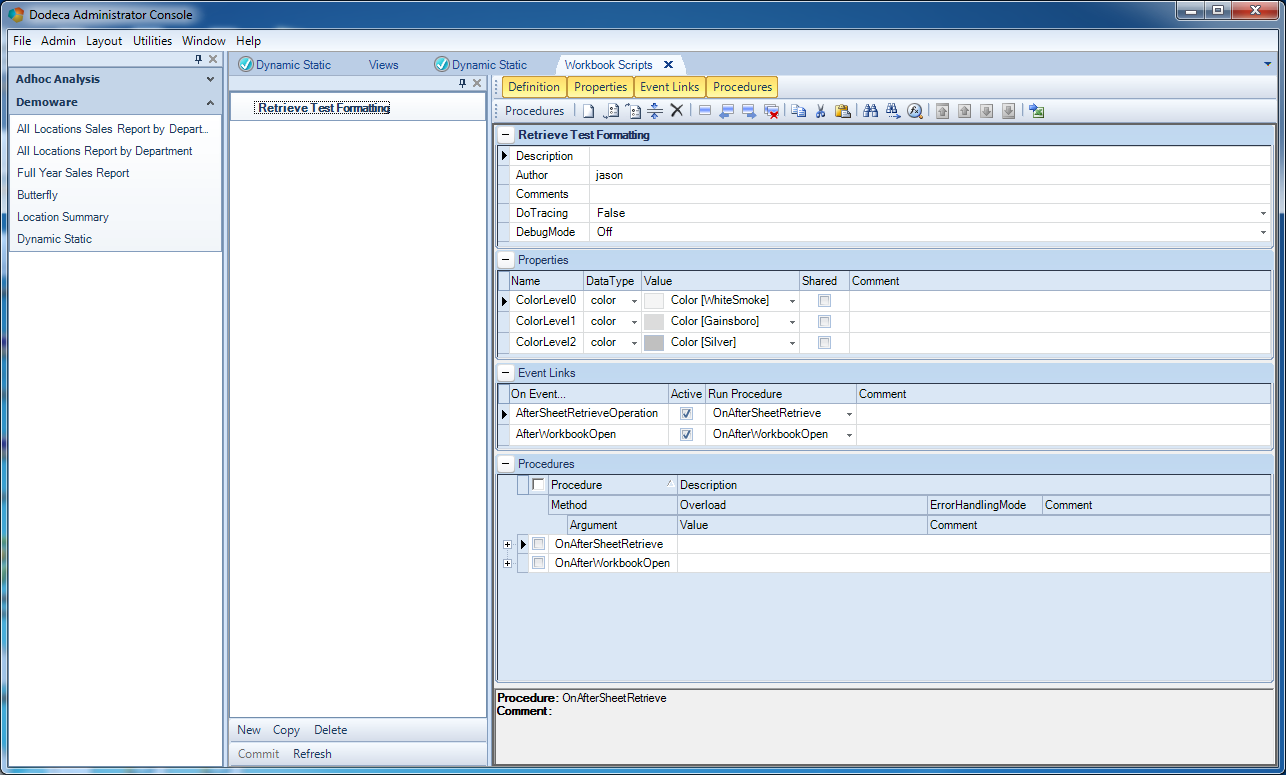
Overview of Workbook Script (WBS) for the view: Properties, Event Links, and Procedures

Isn’t that kind of interesting, actually? I didn’t have to specify some hexadecimal value or anything – WBS inherently knows about a property type that happens to be a color, and it even pops up a color picker dialog when we want to configure them. Nice.

Event Links

Workbook Scripts are event-driven. Essentially this means that we can attach behavior to wherever we need it in the view lifecycle. For example, for this script I need to put custom behavior in for when the workbook opens (to set some colors), and then some behavior that fires any time that a retrieve operation is performed in the book (e.g., when the user double clicks on a time period).

You can see the two events I am using in the previous screenshot. I have procedures specified for the AfterSheetRetrieveOperation and AfterWorkbookOpen events, that will execute the methods OnAfterSheetRetrieve and OnAfterWorkbookOpen respectively.

Procedures

This is the last thing we need to make it all work, and this is really the crux of the script, where we actually do something. Let’s first look at the OnAfterWorkbookOpen procedure. We’re going to use this event to initialize color values in the workbook. You see, one of the ways that Excel works with colors is that there can be a fixed palette where an integer refers to a specific color (it’s also possible to create colors arbitrarily, but in this example it’s actually more useful to refer to colors by index). Referring to colors by index is going to be really useful for us because we are actually going to just take the level of an Essbase member (0 = Month, 1 = Quarter, 2 = Total) and use it to figure out the right color. We definitely don’t want to use the default color palette because this would have us end up with red, green, and blue.

What we can do, however, is set arbitrary colors for indexes. Therefore, when the workbook opens, we want three methods to fire to set a color index for each of the variables we defined earlier. In the following screenshot, notice the three SetColor methods. You can ignore the first seven rows of the method (the rows containing SpecifySheetBy, SheetSpec, Address, so on). These are part of every WBS method but oftentimes we don’t need to set them (we’re going to use them in a moment for the other methods, though, so stay tuned).

The only configuration for the SetColor method we need to concern ourselves with right now is the Color and the Index. Each SetColor method is going to set a different color index (1, 2, and 3) for one of the three color level properties we set. The @PVal (property value) function references the respective property value for us.

Note that for technical reasons I decided that the color index to change for a given level would be that level plus one. So the color index for members at level 0 is 1, level 1 is 2, and level 2 is color index 3.
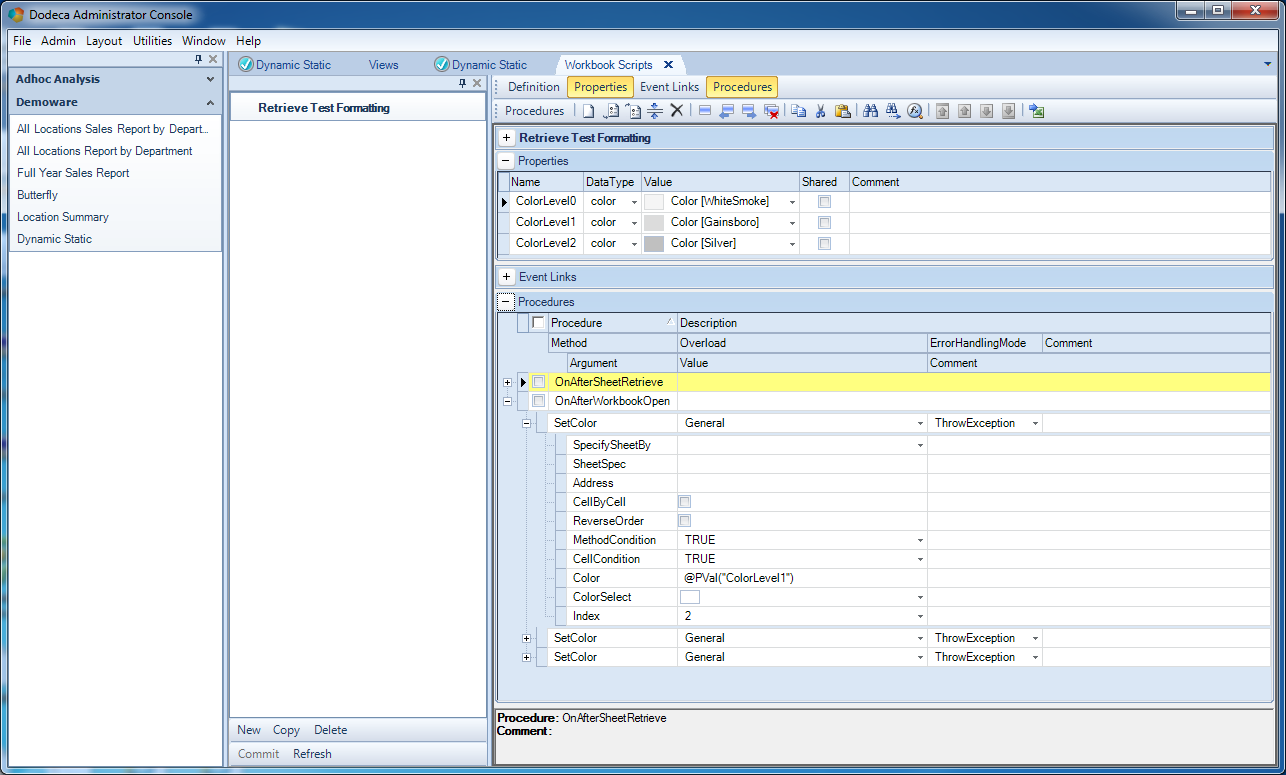
Setting color index values for the sheet based on properties

Where the Magic Happens

We only need to set the colors once when the workbook opens (as opposed to after every grid operation or more often). Now we can turn our attention to the final piece of the puzzle, which is where we are going to dynamically format the newly expanded columns, using a color index we set, processing across a range that is automatically added to the sheet for us, dynamically formatting things based on our column template.

There are just two methods that make up our OnAfterSheetRetrieve procedure. The first is to set the cell background color. This is the background color for the header cell in a given column and is dynamic based on the level of the member. The second method is where we copy the column template over.

Set the Column Background Color Dynamically

Let’s walk through the method to format the column header color. Unlike our earlier SetColor operations, we are going to adjust some of the base method properties. We’re going to specify the Address and CellByCell options:
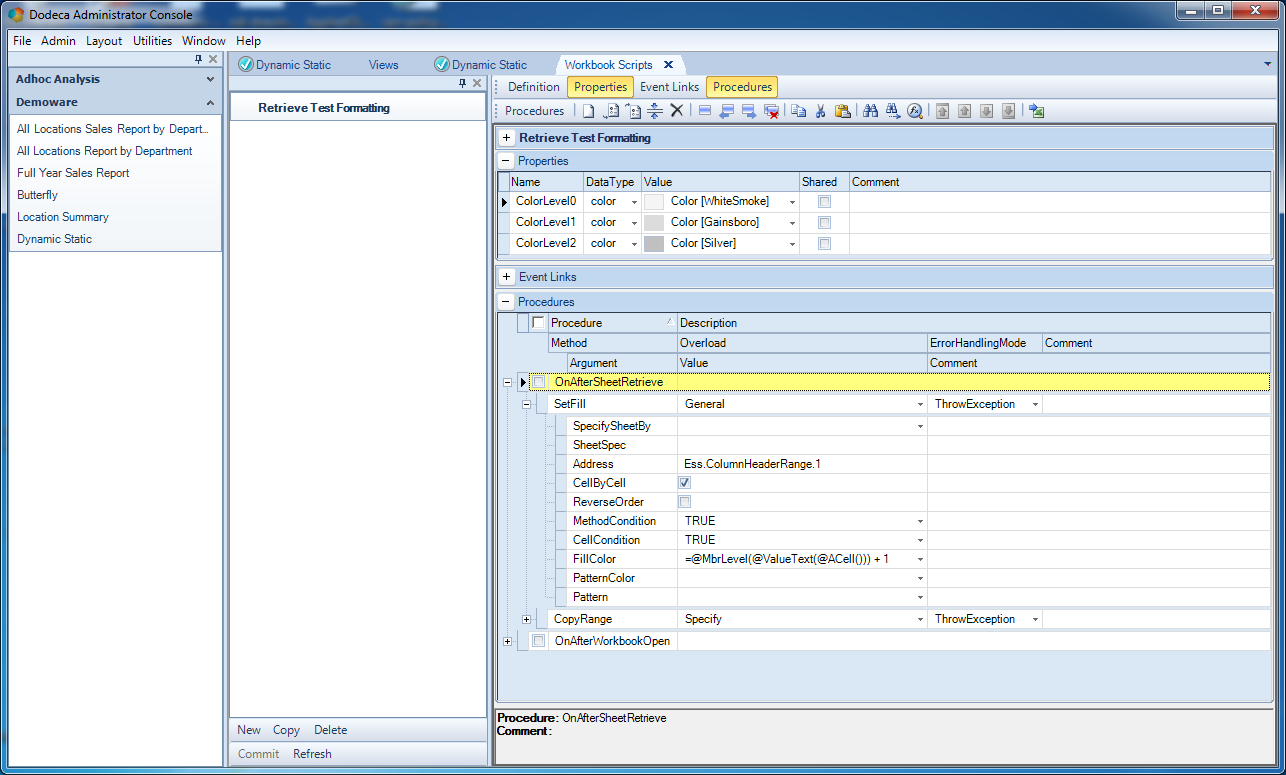
Applying a fill color based on the level of the header of a column

The Address value determines what range the method operates on. Turning on CellByCell means that the method will be called iterative for each cell. Again, I mentioned this earlier but it bears repeating this. This configuration is all in lieu of VBA or other code. Another way to look at it this is that what would typically be many nested FOR loops and conditions in code is now just a couple of simple configurations that we can optionally use.

That all said, the real magic in this method is the FillColor. While we could specify an arbitrary color here, we are actually going to make this dynamic based on the level of the member being processed. We can accomplish that with the following code:

=@MbrLevel(@ValueText(@ACell())) + 1

The function names preceded with @ are all native WBS functions. They typically offer us very handy behavior when it comes to processing things with WBS methods. This formula will take the text value of the active cell, then find out its Essbase member level, then add 1 to it. This lines up with one of the color palette index values we set earlier.

If I wanted to translate the entire method to English, I might do it as the following: please process over every single cell in the range Ess.ColumnHeader.Range.1, then set the fill color to the color palette index that is the level of that member name plus 1.

Copying in the Template Column

Now that we have the background cell color set, we can turn our attention to copying in the template column. We mostly just want this for the formatting, and indeed, we’re going to only copy the format from the template column. This will bring in the numeric formatting we want background color, and borders.

Let’s take a look at the method definition:
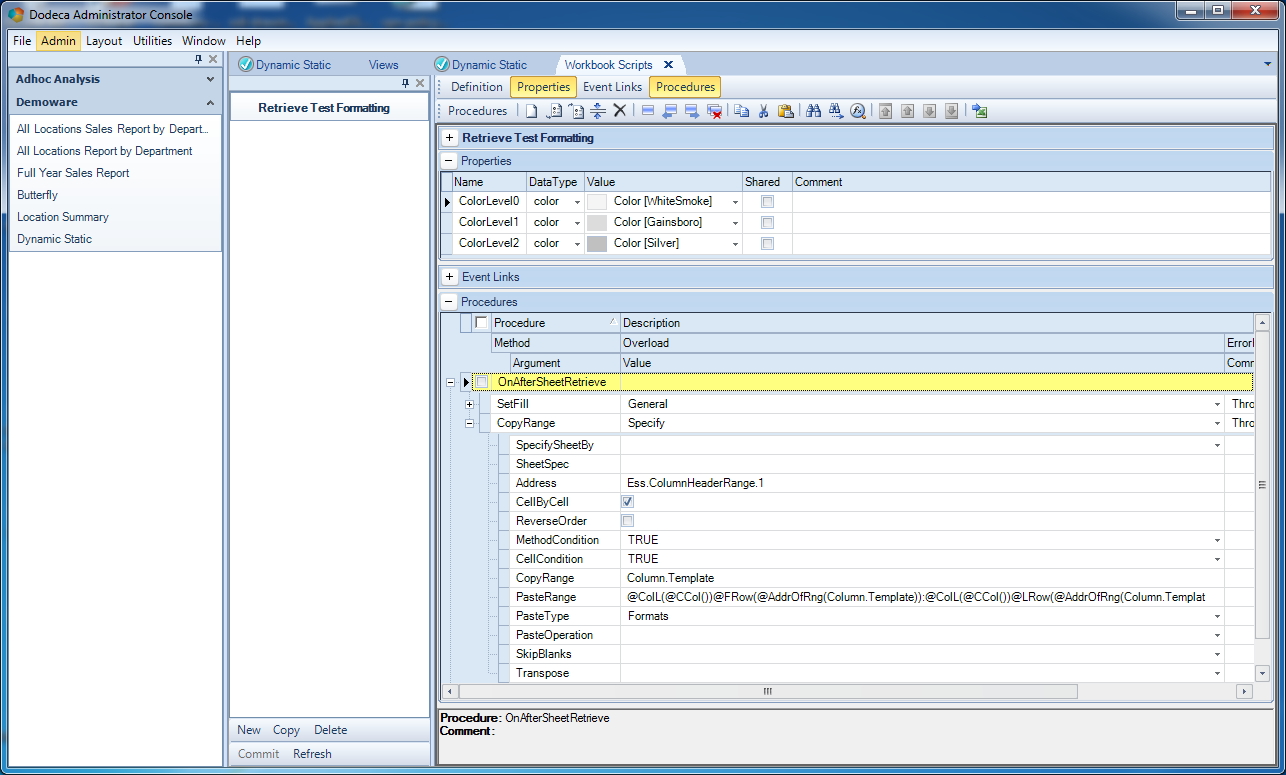
Copying the template range based on the current cellThis time we are using the CopyRange method. As with before, we are going to process over each cell in the column header range, cell-by-cell. The CopyRange method has a few things to set: the source range to copy (our defined range Column.Template), and a paste type (Formats only, as opposed to values or other types of pastes).

The PasteRange is the most crucial element in this particular method. You may notice from the screenshot that it’s a bit of a doozy. I won’t explore it in exhaustive detail, but I want to point out that basically what’s going on is that we are iterating over each cell in the column header, and we need to specify the column range to paste the formats of the column template into. The address for that column range is therefore based on the address of the current cell, but is below it and has a certain determinable height (i.e., the same height as the column template itself). If you’re interested in the complete explanation of the formula, please contact me and I’ll do a follow up post.

All Together Now

Alright, it took a little while to walk through, but we made it. We built a normal view template based on some Essbase data and selector values (a bread and butter view for Dodeca, if you will) with some light formatting, but then decided that we wanted our users to have a little bit of advanced functionality to dig into one of the dimensions a little further. So we turned on the ability to zoom on members in just a particular dimension, then added some workbook scripting to apply some dynamic formatting for us. Although we had a couple of relatively “dense” expressions in a couple of workbook script methods, it was all pretty logical – and perhaps more importantly, is much more maintainable and less complex than the equivalent VBA would have been.

Now when the user opens up and builds the view for the first time, they get this:

A fairly typical Dodeca Essbase view built around a single retrieve and some light formatting

And a simple double click on Quarter 1 will change the report into this:

Result after double clicking on Qt1 (children are shown)

And that happens all without having to go to a different view or rebuild the report. I hope you found this example with advanced view options and some custom WBS useful, and as always, don’t hesitate to reach out with any questions.