jason's hyperion blog

essbase from the trenches

Camshaft MDX tool updated and available

Some of you may recall a tool I released quite some time ago (seemingly to beta-testing purgatory) called Camshaft. Camshaft is a simple Java utility that executes a given MDX query against an Essbase cube and outputs the results. The original version of Camshaft came out around two years ago. This version is built on the same framework but includes various updates and new options. In the interim, the output abilities of the MaxL interpreter have been improved a bit, and with the right incantation it can now output pretty useable data.

The name Camshaft is actually a portmanteau of who the tool is named for, and the feeling that he gets when writing a load rule (especially one loading in MDX data). It’s not every day that a tool is named after a tool, but I digress (I kid, I kid!).

Anyway, Camshaft offers a fairly wide array of options to customize the output from an MDX query. You can suppress headers, choose your column delimiter, how to format #Missing/#NoAccess cells, and more. There’s even an output option to generate an HTML table if you want.

You could run this query, for example:


SELECT
        CROSSJOIN({[Jan], [Feb], [Mar]}, {[Curr Year], [Prev Year]}) ON COLUMNS,
        {[Measures].Levels(0).members} ON ROWS

And you might get this output (depending on options):


	                        Jan, Curr Year          Jan, Prev Year          
	Original Price          #Missing                #Missing                
	Price Paid              #Missing                #Missing                
	Returns                 #Missing                #Missing                
	Units                   #Missing                #Missing

Of course, maybe you want Jan, Curr Year to be on multiple lines. Just pass in the --line-per-header command-line argument and get that output:


	                        Jan                     Jan                     
	                        Curr Year               Prev Year               
	Original Price          #Missing                #Missing                
	Price Paid              #Missing                #Missing                
	Returns                 #Missing                #Missing                
	Units                   #Missing                #Missing  

It’s fairly flexible. You can output to the console or a given text file, and more. You can suppress the whole header if you want. The latest version of the documentation for Camshaft is online (and will be updated from time to time as refinements are added), as well as inside of the Camshaft downloadable file. The Camshaft download site is here (also available on the small Camshaft info page).

Camshaft is a free utility offered with no support or warranty (although feature ideas are welcome), and is closed source (for now), although sometime in the future I may just open the source code up so that some intrepid developers can do what they want with it.

Vess + Dodeca for Substitution Variable Management

I’m gonna go a little crazy today and combine two worlds, just for fun: the Vess “virtual” Essbase JDBC driver, and of course, Dodeca. I’ve written about Vess before, and even talked about it for a bit during Kscope16 earlier this year during a presentation with Tim Tow and Harry Gates on various interesting things we’re doing with Java and the Essbase Java API.

As a quick crash course on Vess, it’s a highly experimental Java JDBC driver that models an Essbase server’s applcations/cubes/properties into variable relational tables (I’ve written about Vess a few times before). At the moment this includes cube outline data, cube data, substitution variables, miscellaneous properties, and more. For example, when you connect Vess to, say, Sample/Basic, one of the tables you’ll get is SAMPLE.BASIC_VARS and it’ll contain four columns: the application, cube, variable name, and variable value. You might think you wouldn’t need to know the application and cube for this table but due to a nuance with Essbase variables (you can have the same variable name at both the cube, application, and server level) it’s actually needed.

In any case, not only you can read values using any SQL you want from these columns, but you can perform operations on the table that in turn affect the Essbase server. So you can do an UPDATE or DELETE and it’ll change the variable’s value, or delete a variable.

With that in mind, I thought to myself, you know what might be interesting – What if we added a Vess driver to Dodeca (since Dodeca supports third-party database drivers) and wire up a simple view that can edit the variables? So that’s exactly what I did and I thought it’d be fun to share.

Adding Vess to Dodeca

The first thing to do is add the Vess library and a couple of other Java libraries that it leans on to the Dodeca servlet. Typically you’d want to add these to your Dodeca WAR file when you build it with the “Click Once Prep Utility”, but since this is just for testing purposes, I can just add the JAR files to the already deployed servlet. I wouldn’t want to do it this way in production because when I went to deploy a new WAR file, I’d lose my Vess drivers. Here’s the drivers added to the /dodeca servlet:

Vess Java JAR files added to Dodeca (dodeca) servlet

Vess Java JAR files added to Dodeca (dodeca) servlet

For good measure I restarted the servlet container (in this case, restarting Tomcat 7 using sudo service tomcat7 restart on this little Ubuntu VM). Then we can login to Dodeca and create a new SQL connection:

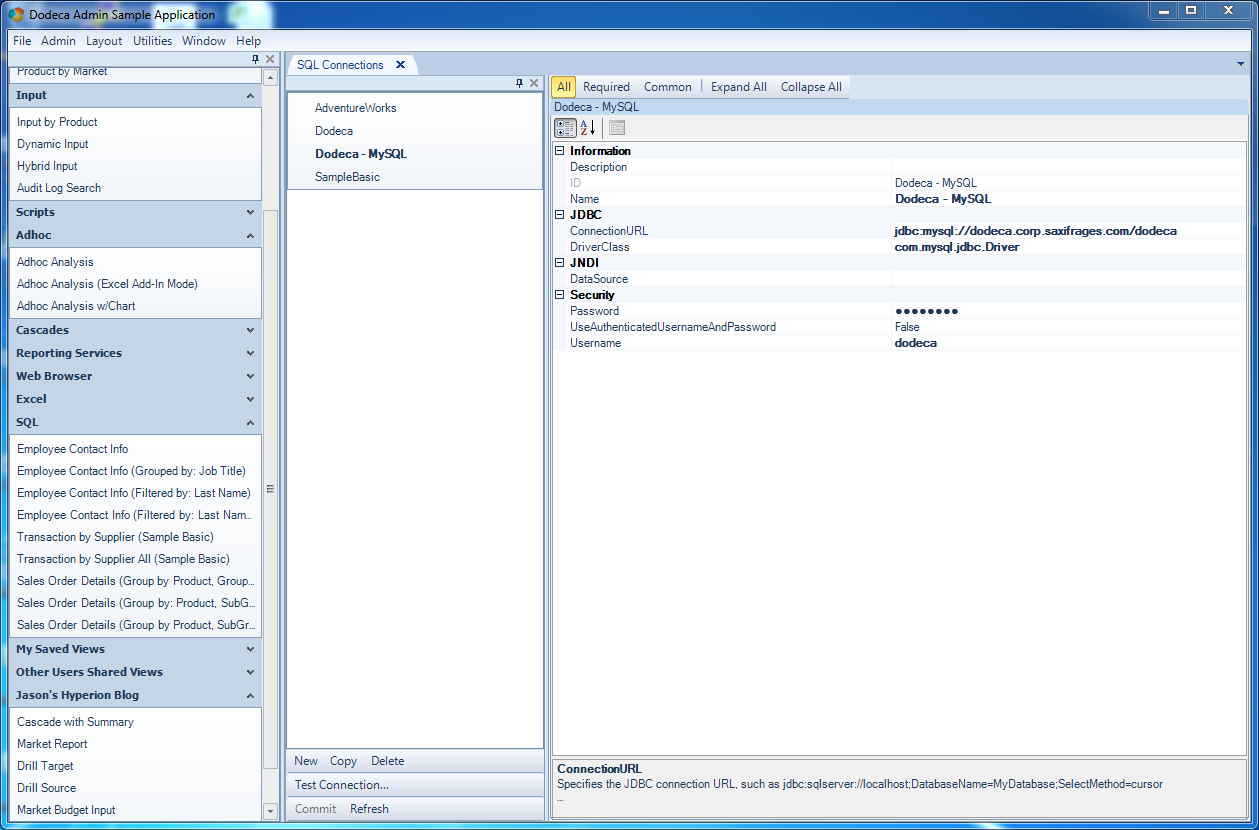
A Vess connection is created inside of Dodeca

A Vess connection is created inside of Dodeca

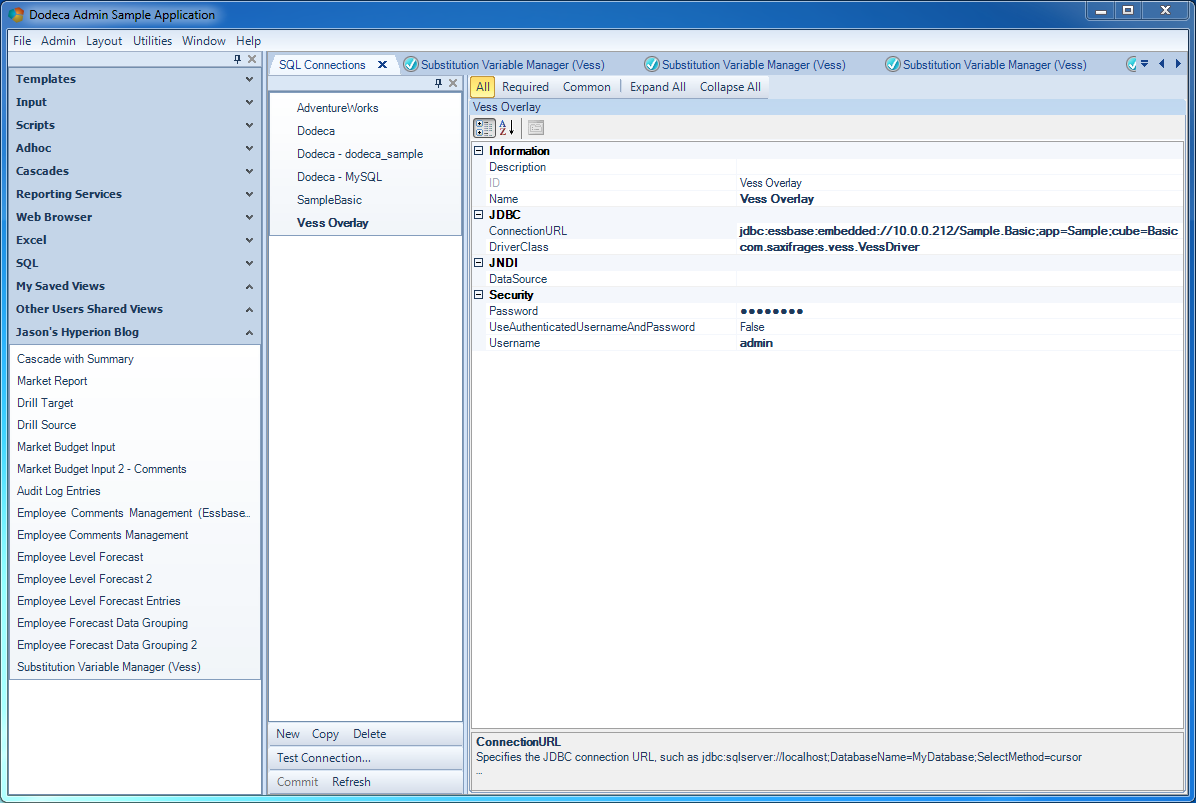
There’s not a lot to see here other than to “show off” that Vess is indeed just a normal JDBC driver as far as other software is concerned – in this case, Dodeca. As you can see, Vess introduces a JDBC URL format. Vess can connect in embedded mode (in this case, indicated in the scheme of the URL. The rest is fairly standard: the address of the server (Vess assumes the default port of 1423 if none is specified), and in this case, a particular app/cube to connect to. Other than the URL, the driver class is specified. As with Oracle/SQL Server/MySQL, the class is just the Java class implementing the Driver Java interface. These typically are thing like com.mysql.Driver or something similar, and Vess is no different in this regard. Lastly for purposes of the Dodeca connection, a username and password are specified. This should be the credentials for an Essbase user, since internally Vess will use them to connect.

With the SQL connection mapped in, I can create the SQL Passthrough DataSet that will contain my SELECT queries, and optionally, parameterized INSERT/UPDATE/DELETE statements if I want to have support for those (which I will).

Configuring the SQL Passthrough DataSet for Vess variables

Configuring the SQL Passthrough DataSet for Vess variables

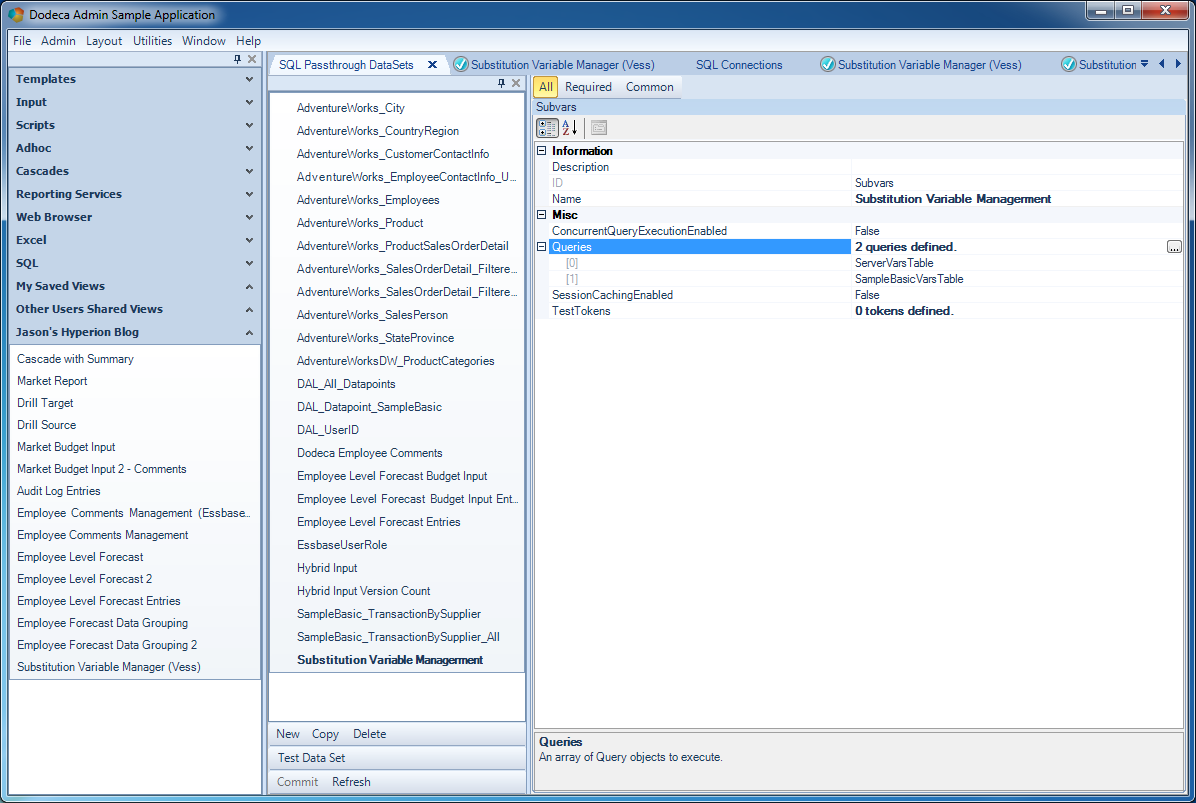
You can see that unlike some of the other SQL Passthrough DataSet examples I have shown lately, this one has two queries. It’s worth noting, briefly, that a SQLPTDS isn’t an object that just contains one query or otherwise concerns itself with one dataset. It can contain an arbitrary number of [usually related] queries. In this case I have two: one for server wide substitution variables, and one for variables just applicable to Sample/Basic (these actually overlap a bit as I’ll show in a bit).

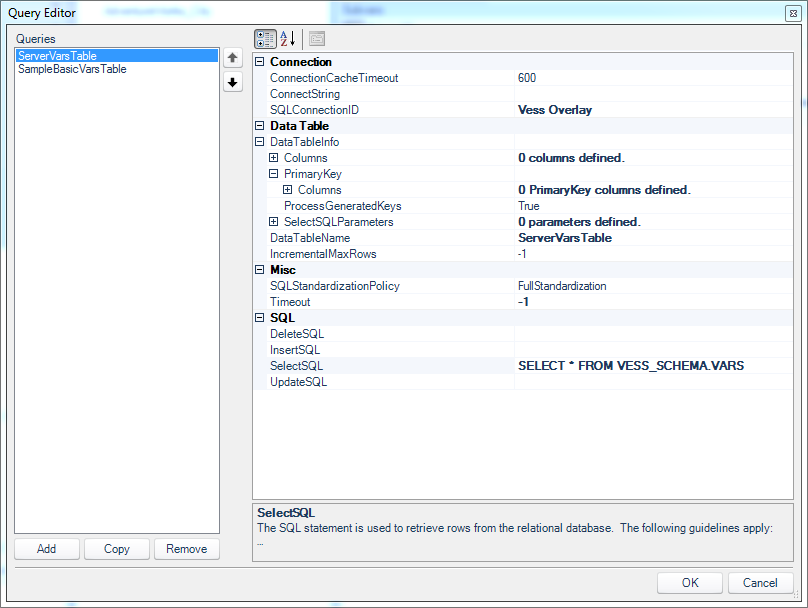
The definition for the “server variables” query is very straightforward and only contains a SelectSQL configuration:

On the Dodeca query editor, looking at the first query for pulling out global variables from the Essbase server

On the Dodeca query editor, looking at the first query for pulling out global variables from the Essbase server

As noted earlier, Vess creates a table in the schema VESS_SCHEMA called VARS that contains the names and values of server-wide substitution variables. Over on the Sample/Basic variables configuration, there’s a little more to it:

The second query is modeled on a specific table for the Sample/Basic database

The second query is modeled on a specific table for the Sample/Basic database

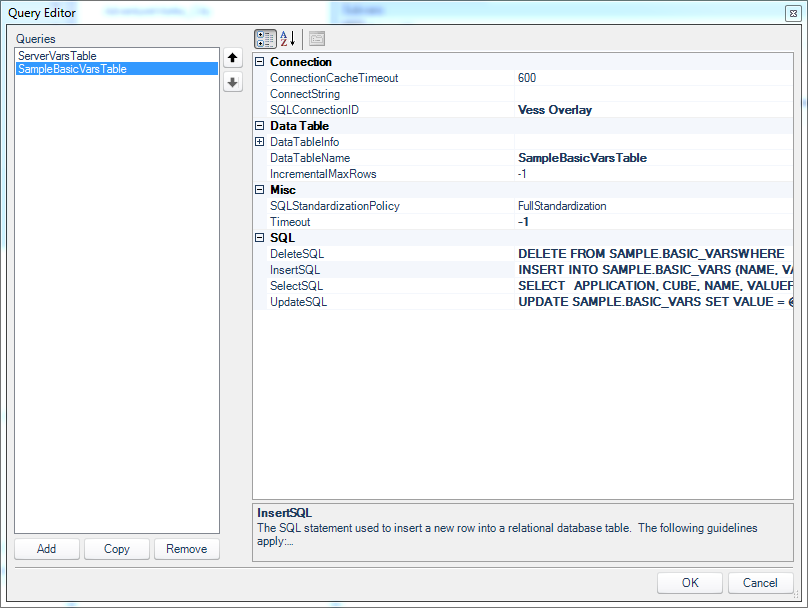
Here there are queries that model the DELETE, INSERT, UPDATE, and of course SELECT operations. Not pictured (it’s collapsed on the config screen) is that I defined the primary key for this table as the combination of APPLICATION, CUBE, and NAME columns (while the final column, VALUE, is not part of the primary key).

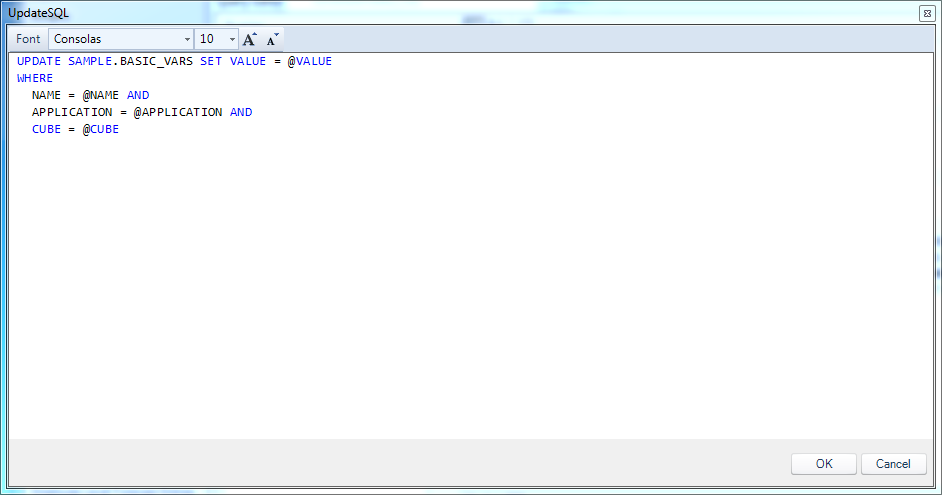
To get a flavor for what the various queries look like, here’s the UpdateSQL configuration:

Dodeca UpdateSQL query for updating a variable's value

Dodeca UpdateSQL query for updating a variable’s value

You can see that the particular variable is identified by three column values (the primary key values), and that the value gets updated for this operation. There are four tokens in play, which will come from the row being edited in the view. There’s no primary key value being generated on the server-side (some of my previous examples had an integer that was generated server-side), so there’s no need for a post-insert select statement.

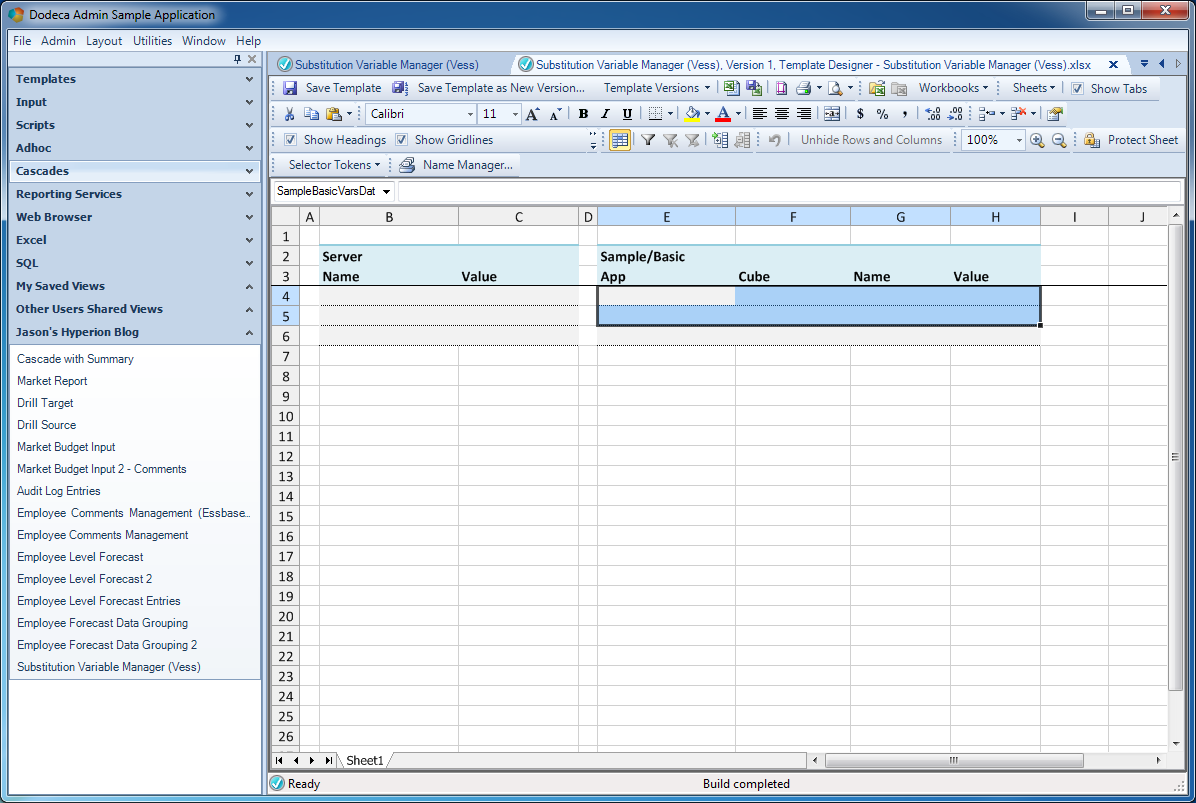
With all of the SQL Passthrough DataSet configuration out of the way (but a little more to come on the view configuration), I can now build a simple view template for showing the data:

Creating a template to display the variables from the SQL Passthrough DataSet

Creating a template to display the variables from the SQL Passthrough DataSet

If you’ve followed some of my other examples, this should seem pretty basic by now. There are two data ranges on this sheet but I’m just showing one in the preceding screenshot. The dataset has four columns, and so there are four columns on the range. That’s actually all there is to the view template itself. The rest of the configuration is on the view to set its data range and wire it up to the SQL Passthrough DataSet:

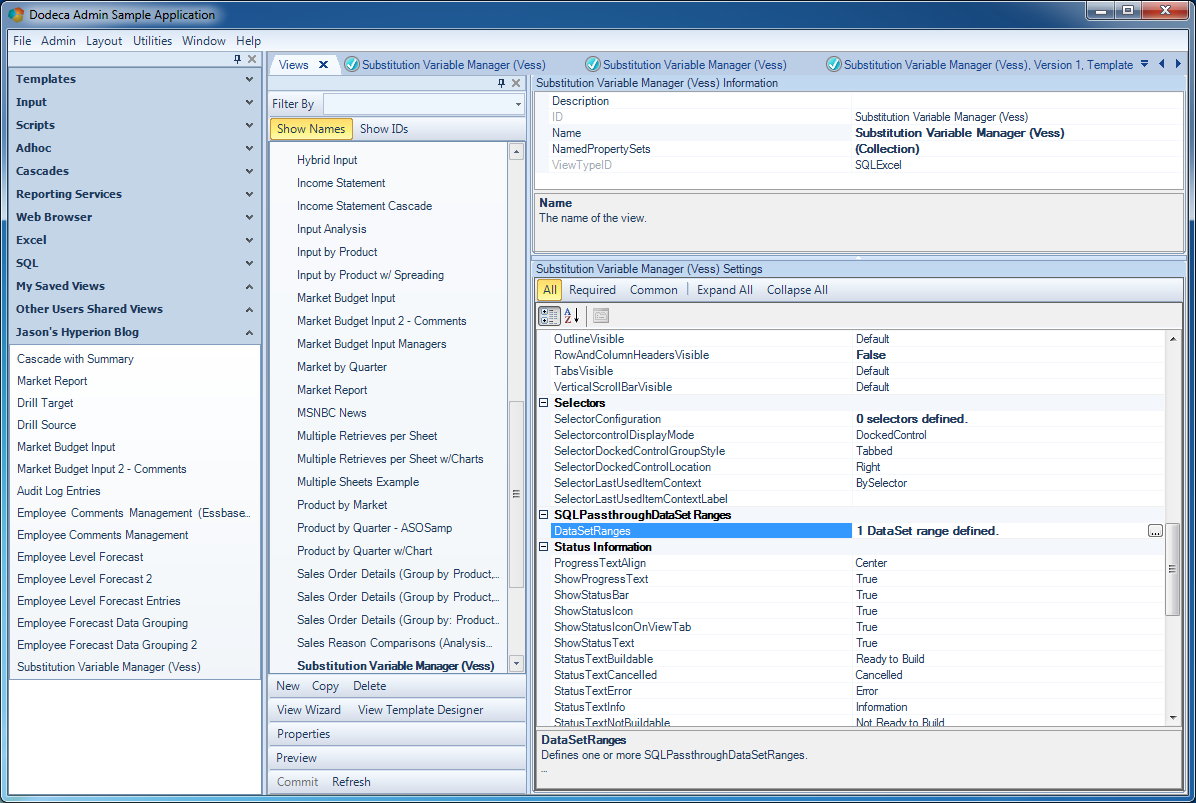
The configuration of the View that will display/edit the variables

The configuration of the View that will display/edit the variables

Noting too special here. You can see that I turned off RowAndColumnHeadersVisible to clean up the final appearance of the view a bit, and I have my one DataSet range defined. Over in the DataSet range definition:

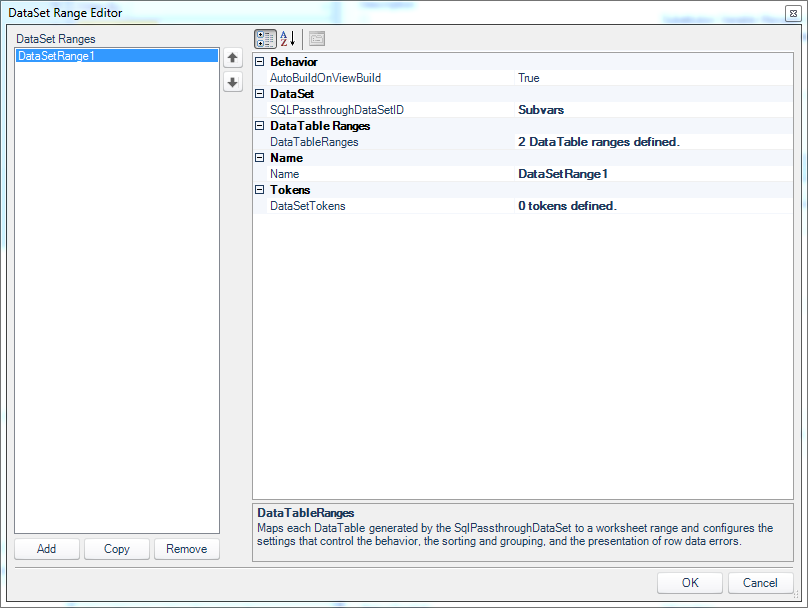
The DataSet Range definition for the view

The DataSet Range definition for the view

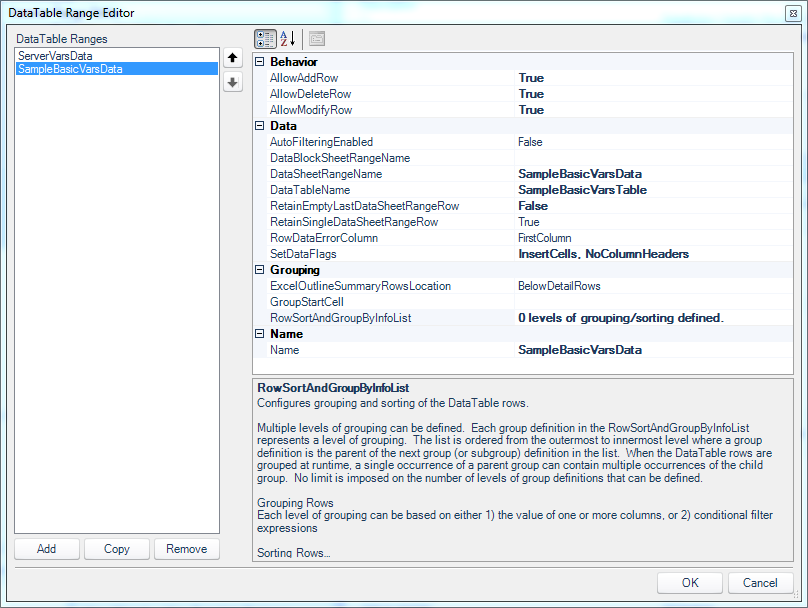
There are two DataTable ranges defined (again, one for server variables and one for the Sample/Basic variables). Now opening up the configuration for the SampleBasicVarsData range (I’ll skip showing the details on the server variables range since it’s pretty simple):

DataTable Range Editor for the Sample/Basic data set

DataTable Range Editor for the Sample/Basic data set

I’ve turned on the abilities to add, delete, and modify rows (INSERT, DELETE, UPDATE). This is a really nice bit of granularity to have in Dodeca since in this case there’s a very legitimate use-case where I’d perhaps want a user to only be able to change a variable’s value but not otherwise delete it or add a new variable. Other than that bit of configuration, I’ve specified the corresponding range name on the sheet/template, and turned on InsertCells and NoColumnHeaders which is fairly standard for me with data sets like this.

Okay, the SQL Passthrough DataSet is setup, the template is setup, and the view configuration is setup. Let’s build this and see what happens:

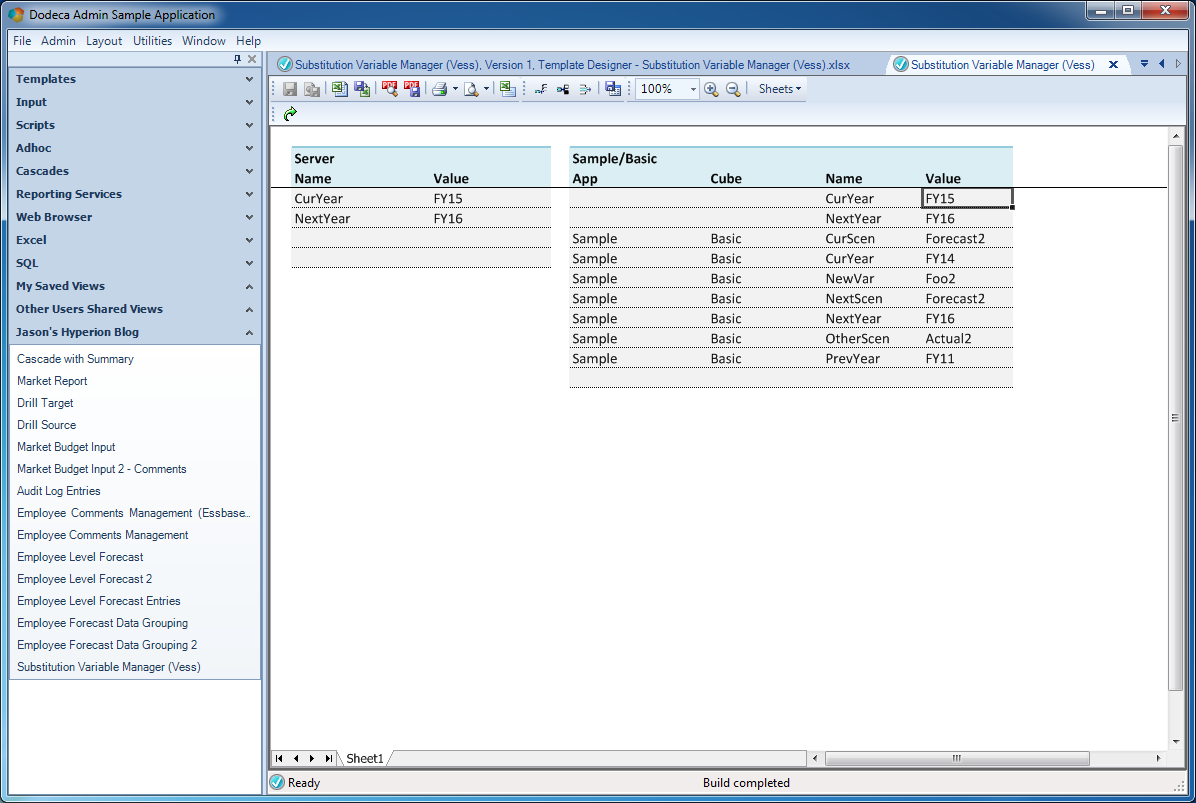
Built Substitution Variable view

Built Substitution Variable view

It looks just like I thought it would! I can see my two server-wise substitution variables, and over on the table for Sample/Basic, I can see all of the variables that I have there. You’ll note that the server-wise variables seem to “repeat” in the Sample/Basic table. You simply have to think of the variables for a single database in terms of what variables are applicable to that database, and server-wide variables are applicable. Of course, if there’s a more specific (specified to the database) variable, it’ll trump the server-wide variable.

If you’re particularly astute with your screenshot reading skills you may notice that in preceding shot the cursor is on a cell in the Sample/Basic variables table, and therefore the row editing buttons on the toolbar are active (insert, delete, save). So I can change a value on a variable, hit the save data button, and Dodeca will perform the proper query from the SQLPTDS. Let’s do that and see what happens:

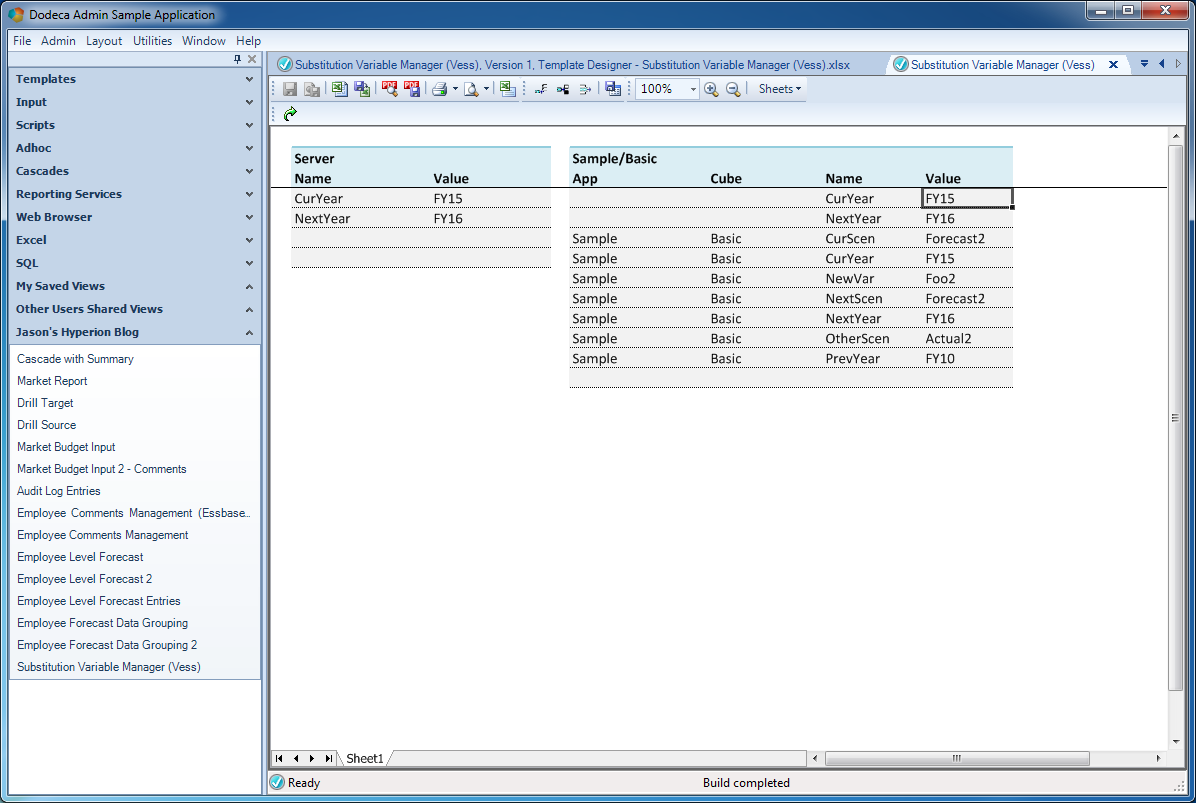
View after updating a variable value

View after updating a variable value

Well, it’s certainly less dramatic with screenshots, you’ll have to take my word for it that the PrevYear variable did indeed update on the server from FY11 to FY10. Under the hood, Dodeca fired off the properly filled in UpdateSQL statement, which of course was handed to the Vess driver, and in turn, Vess translated the call and called the appropriate variable updating logic on the Essbase Java API (magic!).

Summary / Vess Availability & Download

I hope you enjoyed this somewhat unique (or totally unique, I suppose) combination of a couple of different technologies. Vess is a bit of a unique take on things in the Essbase world, whereas Dodeca provides the peas to Essbase’s carrots. And yet, combining the two results in something wildly “interesting”.

I’m not saying that organizations should manage substitution variables this way (and again, the substitution variable aspect of Vess is just one of its facets, but it’s a nice simple one to play with), but this certainly makes it quite possible.

I know of many organizations that specifically or rather, begrudgingly, give EAS to a handful of finance power users that need to be able to tweak variables. Sometimes instead of EAS you’ll see one-off MaxL scripts where the update procedure is to tweak the script or a text file and run it. All too often this also involves plain-text credentials, hassling with installing the MaxL runtime on a ‘regular’ desktop machine, and more. So in this particular case, while the Vess driver actually does a lot more than just substitution variables, it can be leveraged for an innovative solution that is “cleaner” than many alternatives.

As an alternative (and still using Dodeca), we could have actually shelled out to launch a MaxL script and pass along the variable value, achieving much the same effect. This could work but obviously would be much more configuration. And to the extent possible I don’t like to create solutions that are ostensibly web-based that need to “drop down to the file system”, since it usually (in my experience), introduces a somewhat fragile or ‘sensitive’ element to the system that seems to act up or break relatively often.

Vess is still “highly experimental”, which I guess is a nice way of saying “a lot of things can go wrong, there’s no warranty, but it works… mostly. Asterisk.” Anyway, Vess isn’t available as a public download, but if you’d like to play with it, please feel free to contact me and I can provide the file and some basic instructions.


Dodeca Dynamic Grouping with Relational Data

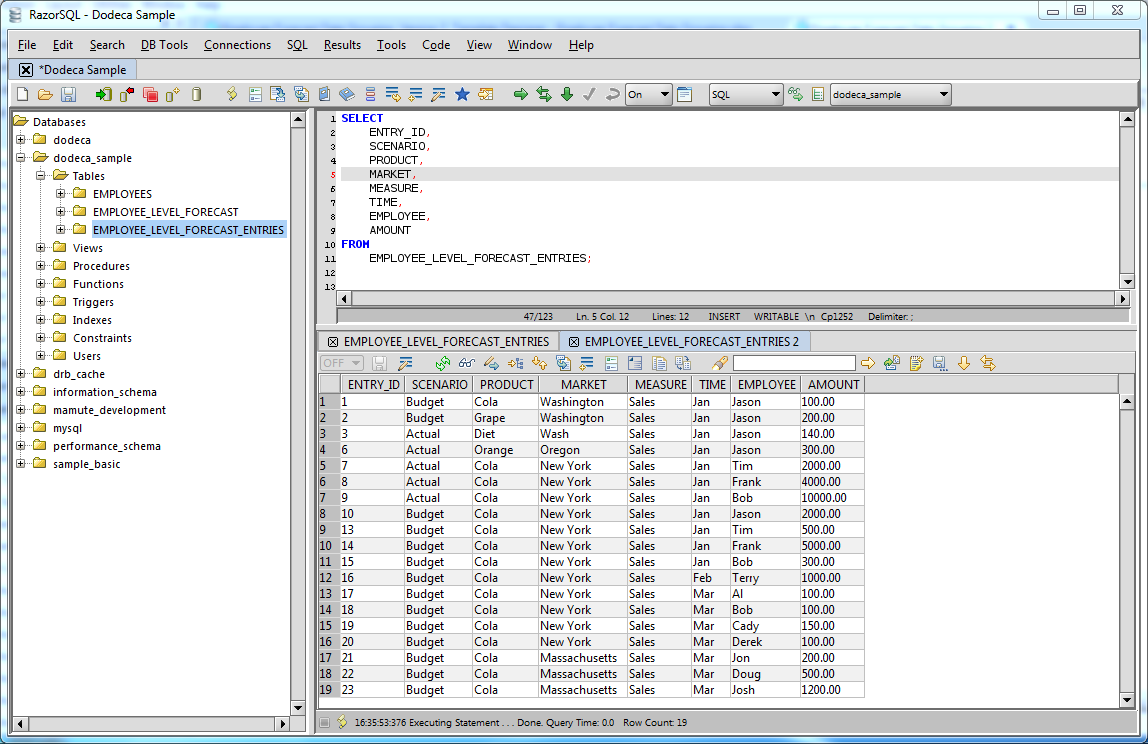
I am very pleased today to write about an incredibly awesome Dodeca capability: dynamically built groups based on relational data. This capability is interesting and useful for a variety of reasons. Using Dodeca’s spreadsheet/data/magic build paradigm, we can organize plain relational data into beautifully formatted, insightful, and dynamic views. Just to forecast where I’m headed with this, what we’re going to do is transform this plain relational data:

Some raw forecast related data

Some raw forecast related data

Into this dynamic, grouped, and formatted view:

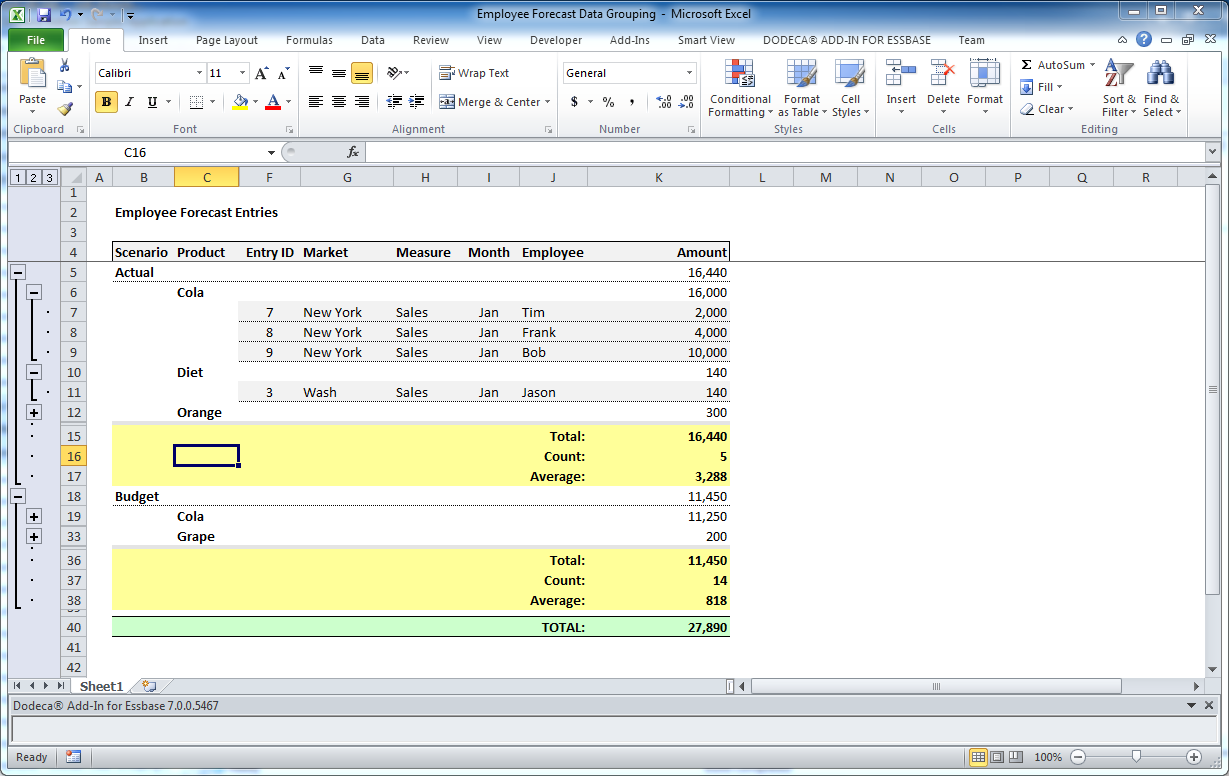
Dodeca dynamic grouping opened up in Excel

Dodeca dynamic grouping opened up in Excel

And further, we’re going to do it without writing a single line of code (save for the simple SQL Select statement). This post will assume that you’re up and running already with Dodeca’s SQL Passthrough DataSets, which I have written about before, so head over for a refresher if you need it. Also, I’ll be recycling a simple SQL table with forecast data by employee that I also used in an earlier Dodeca relational database input article, so you can read that if you want to know more about the data in play and how it relates to Sample/Basic.

Overview

To set the stage for the rest of the article, it might be useful to talk about what the pieces in play are and how fit together:

  • SQL Passthrough DataSet: As covered in earlier articles, the SQL Passthrough DataSet is a discrete object within Dodeca and is where we define one or more SQL queries and an associated (also defined in Dodeca) relational connection to use. SQL Passthrough DataSets are building blocks that are referenced in other places in Dodeca, such as views and selectors. For this example, the SQL Passthrough DataSet we’ll use is relatively simple, containing basically just a SELECT query that returns the data we want.
  • Grouping/Outlining functionality: this functionality is built in to Excel (and also supported in Dodeca). Grouping can be used in Excel to group similar items together such that they can be subtotaled in some way or displayed more compactly by the user. For the purposes of this article, our goal is to not just retrieve some data from a particular relational table, but to dynamically format it and put it in to groups for the user.
  • Excel template: as with the other numerous examples I have discussed in the past, the Dodeca view will be built around a specially formatted Excel template. In this example, the Excel template is a little more nuanced in terms of the defined names/ranges and how they tie in with the configuration of the view
  • Data Table configuration: More so than the other examples I have covered so far, in addition to specially formatting the Excel template for how we want to see our relational data, we also need to tell Dodeca how the data should be grouped, sorted, and how it ties in with our formatting.

As a sidenote, in order to keep things relatively simple here, I have chosen not to put any selectors in the view in this article. They are, of course, completely supported and in the future I’ll show some examples of that, in addition to some really interesting examples that combine relational and Essbase data.

Small Disclaimer

Before we really dive into things, I want to just mention that you’re going to see a fair number of configuration screens that need to be traversed in order to build the solution. I don’t want you to get the impression that the configuration needed is overly cumbersome. The thing is this: there are an infinite number of ways to configure how the raw data we are working with can be grouped, sorted, and displayed to the user. And as such, we have to be particular with how we define how it all works. Most of the configuration screens you’ll see are ones that you should already be familiar with if you’ve put a SQL dataset onto a Dodeca view. So the number of new screens here is fairly small. And for what it’s worth, I want to stress that other than the simple SQL SELECT query itself, we can achieve everything here without writing a single line of code, which is really saying something.

As a consultant I was engaged on numerous projects that attempted to achieve similar levels of functionality by using a custom in-house solution, usually along the lines of augmenting an Excel book with piles of custom VBA code. Now, nothing against VBA, but also as a consultant I saw time and time again that these processes became technical liabilities that made upgrades and migrations troublesome. Frequently the original author of the code had moved on as well, making updates and fixes incredibly problematic, time-consuming, and prone to error. So the thought of being able to replace mountains of custom code with something entirely declarative, maintainable, and faster to develop is amazing. So please bear with me as I work through and explain the configuration involved, it’s worth it!

Let’s Do This (#MakeSQLGreatAgain)

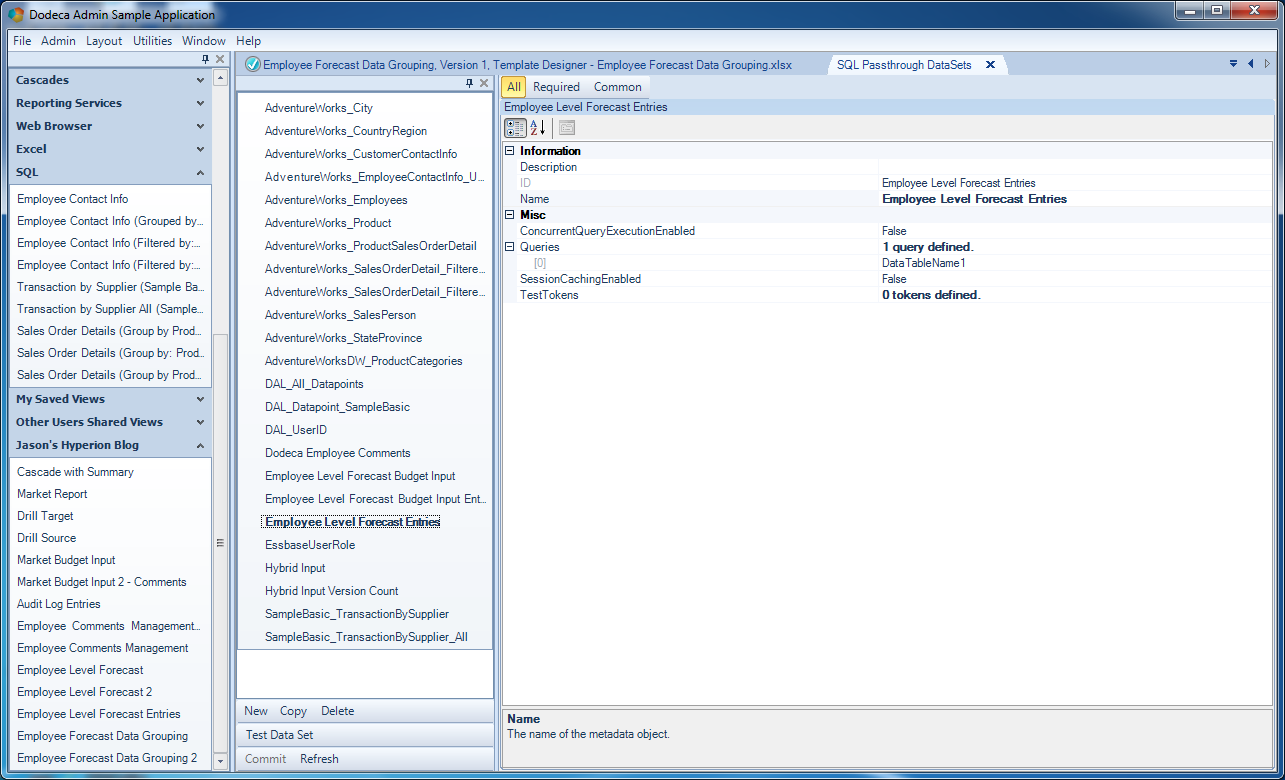
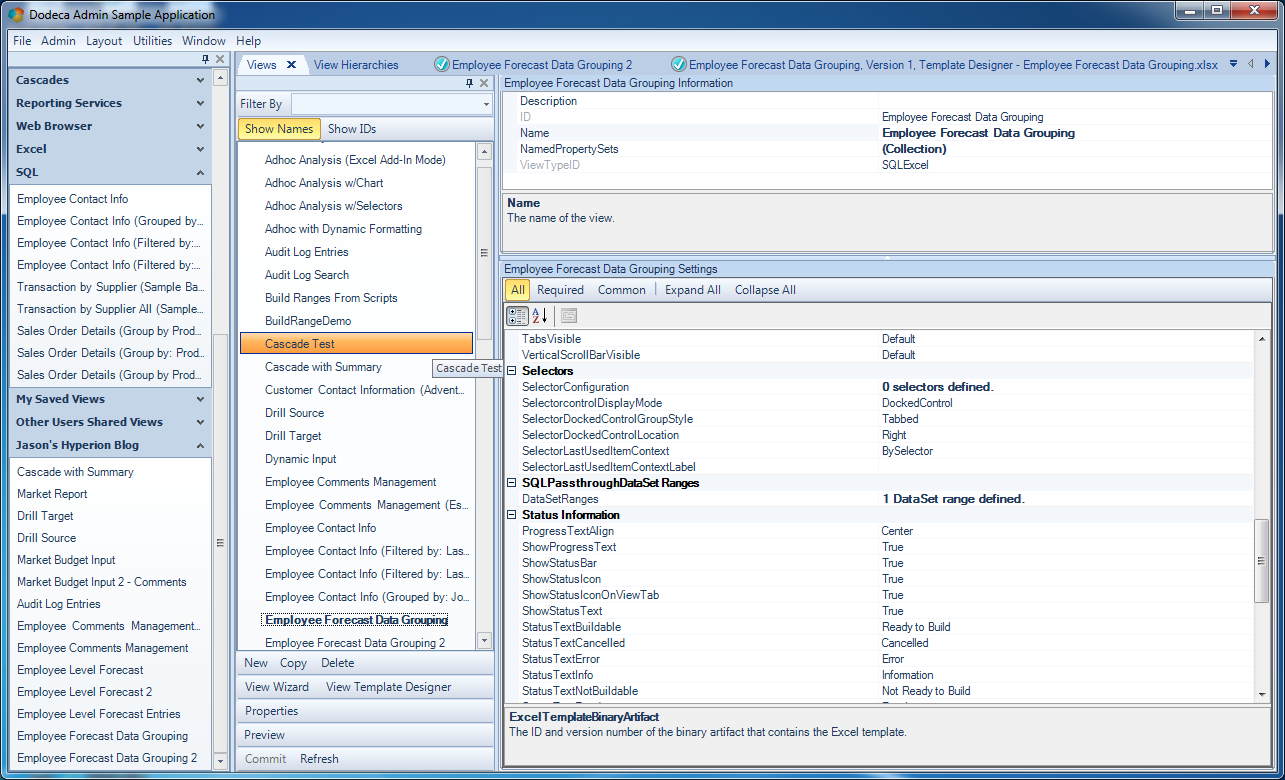
Above you already saw a snapshot of the data we’re working with. Our goal is to group this by scenario and product into a custom formatted arrangement. Given that data, we need to first create or otherwise ensure that our Dodeca SQL Passthrough DataSet exists. Here’s the overview of this particular SQL Passthrough DataSet:

Base Dodeca SQL Passthrough DataSet configuration for demonstrative employee forecast data

Base Dodeca SQL Passthrough DataSet configuration for demonstrative employee forecast data

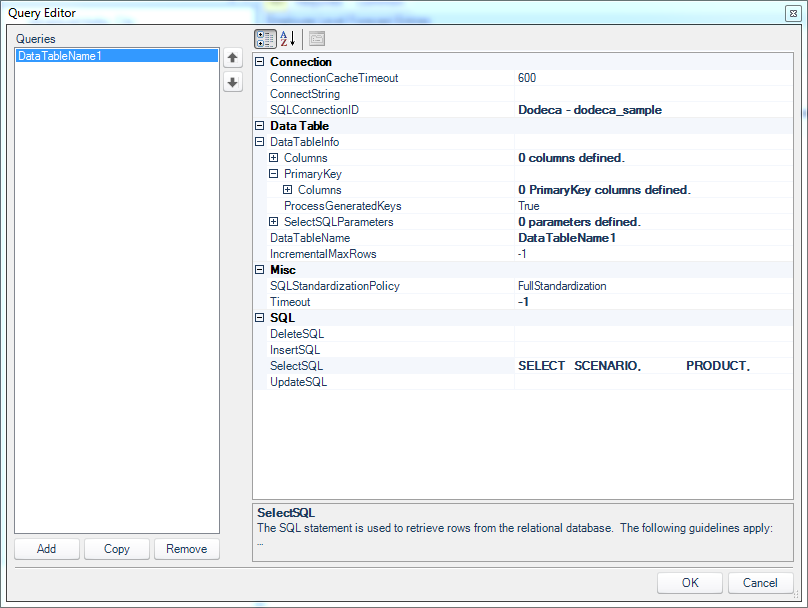
This is a very straightforward and common view of the SQLPTDS. Just note that there is a single query defined. Let’s go take a look at the definition for that query:

Query editor for employee forecast data SQL Passthrough DataSet

Query editor for employee forecast data SQL Passthrough DataSet

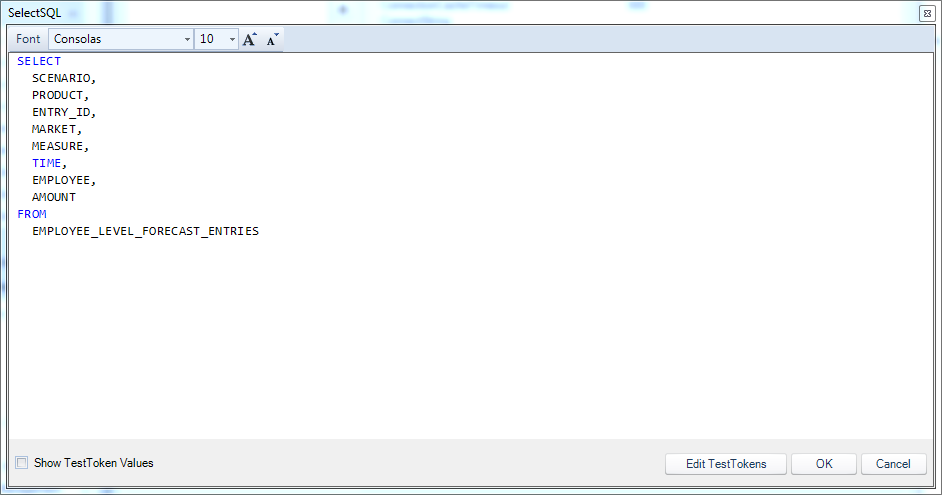
You may recall from some of the relational data input examples earlier that we specifically defined columns and primary keys. We aren’t going to do any updates here so we can leave those with default values. The only thing of note here is the definition of the SelectSQL configuration:

Query to pull records out of the employee forecast entry table

Query to pull records out of the employee forecast entry table

There’s nothing too fancy with this query. As I mentioned earlier, we’re not going to tokenize this for now, so the query will simply return everything from the table. With the SQL definitions done with, we can now turn our attention to the view itself. There’s not much in the way of non-default view configuration either, but you will note I have one DataSet defined:

Basic view configuration for our view that will display data from the configured SQL Passthrough DataSet

Basic view configuration for our view that will display data from the configured SQL Passthrough DataSet

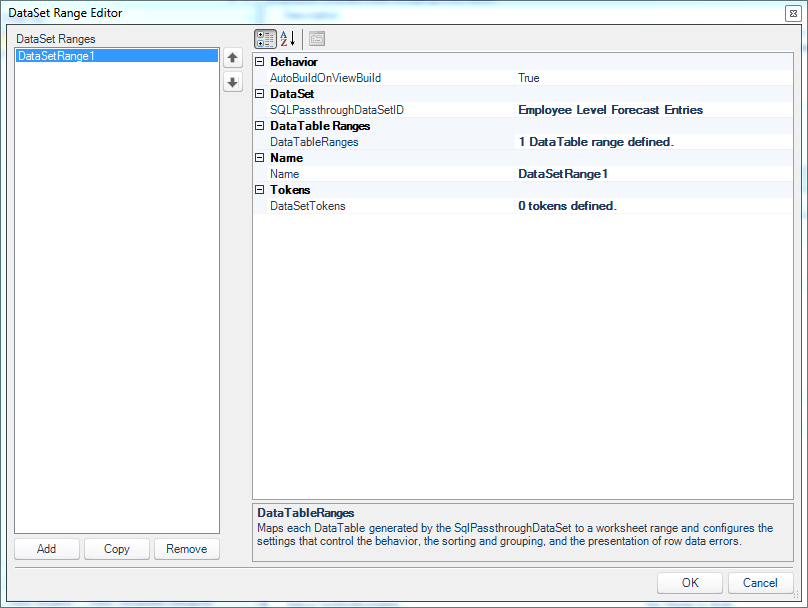
Let’s open up the DataSet Range Editor (by clicking through from the DataSetRanges configuration on the view) and take look at the configuration.

DataSet Range Editor on demonstration view

DataSet Range Editor on demonstration view

This is a pretty straightforward configuration screen without much to note. This is sort of the first place that associates our view to a distinct SQL Passthrough DataSet, so you can see where that is chosen and that there is one DataTableRange defined, which we’ll now take a look at:

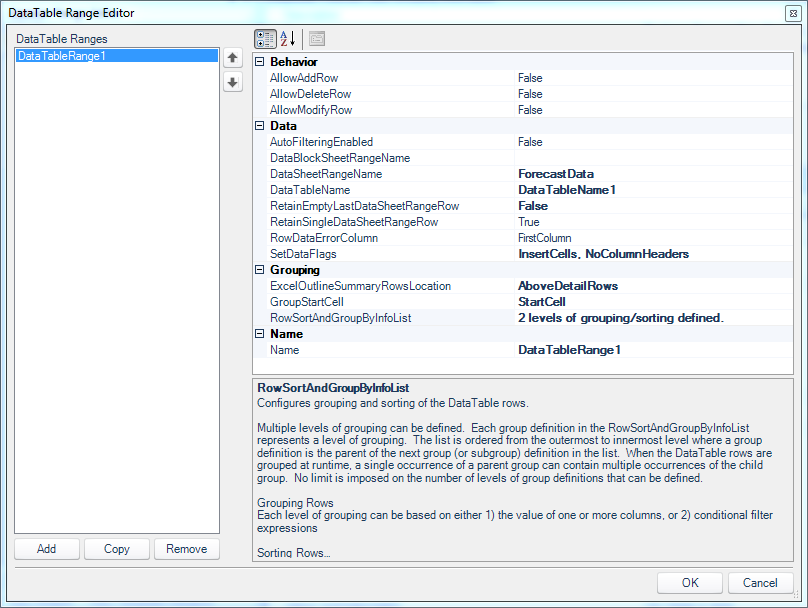
DataTable Range Editor for the views DataTable

DataTable Range Editor for the views DataTable

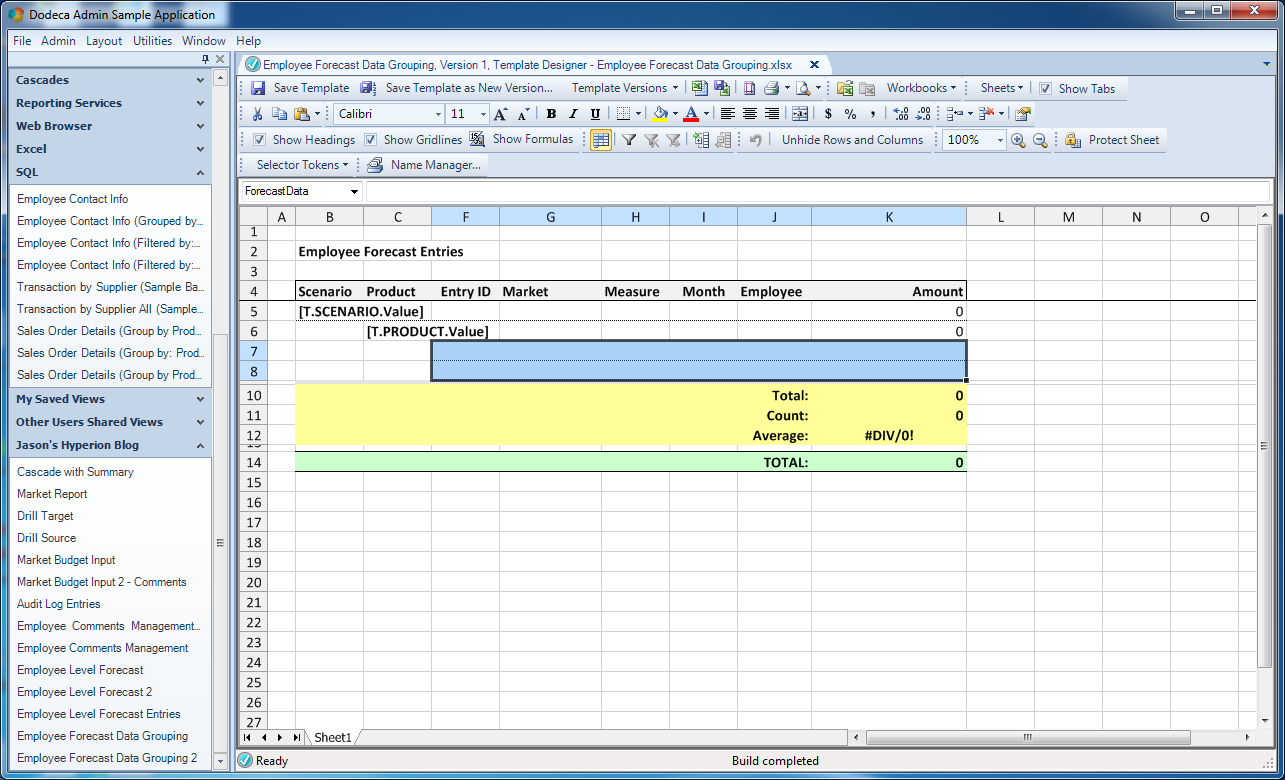
This is where things get interesting (finally), let’s walk through the elements involved here. The first configuration value of note here is the DataSheetRangeName set to ForecastData. This is where we are associating the data in the table (SQL Passthrough DataSet) to a particular named range in the template that will contain the data. Let’s skip ahead for a moment to take a look at this named range in the template:

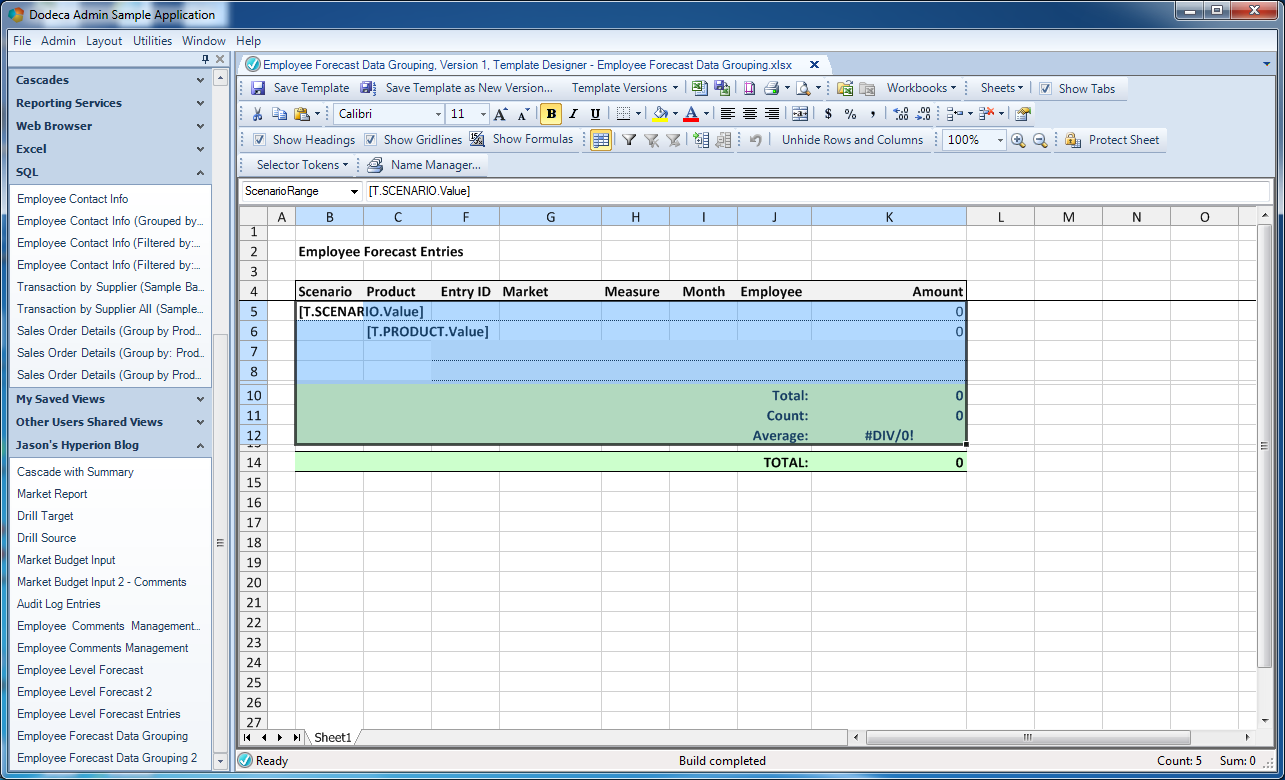
Excel template defined range for SQL Passthrough DataSet data

Excel template defined range for SQL Passthrough DataSet data

Notice that I have the ForecastData range highlighted. Notice also that there is one cell in the sheet per column in the SQL Passthrough DataSet. It may seem that I am two columns short, but I actually have columns D and E hidden. These correspond to the Scenario and the Product in the data set. As you’ll see in a moment, the way I want to actually format these is that since these items make up the groups themselves, I thought it’d be redundant to show them on every row, so I just those columns (but leaving them functionally available so that Dodeca can use their values to group/sort accordingly).

Switching back to the configuration, I have a DataTableName set. This doesn’t really matter for my configuration right now so I just went with the default value of DataTableName1.

For formatting reasons, I set the RetainEmptyLastDataSheetRangeRow to False. When set to True, Dodeca will leave an extra row on data sets so that we have a natural spot to insert a new row (if we are editing the data set). Since we’re not doing any updates, and because I want to format things a little more “tightly”, I decided to make this False and leave out the extra row.

Next, over on SetDataFlags, there are multiple options enabled. These are InsertCells and NoColumnHeaders. Selecting InsertCells tells Dodeca to insert (as if by inserting a row in Excel manually) rows to the sheet when it builds it from the data. This has the effect of preserving the formulas on the sheet and their relative references. In other words, if some formula refers to a range (such as the SUM of a range) that is one cell wide by two cells tall, and we insert a cell into the middle, we want the SUM to expand to now include the three cells in height. This is just fundamental to how Excel and spreadsheets work, as well as preserving references during the Dodeca build when rows or cells are inserted.

Dodeca can return the column headers from the SQL dataset if we want them. If we did want them, then the ForecastData named range would be three rows tall instead of two as we have it. We don’t really need the column headers because we’ll put in our own “pretty” headers on the sheet and just want the data, so I’ve turned them off. Skipping over the Grouping section for a second, also notice the Name configuration value, which is just a default value we don’t need to worry about for the moment.

Grouping Configuration

Again, the options I’ve just covered won’t be new to you if you have configured SQL data on a Dodeca Excel view before. But now I’m going to get into the part that will be new to you if you haven’t worked with grouping. You’ll notice in the Grouping section three different options: ExcelOutlineSummaryRowsLocation, GroupStartCell, and RowSortAndGroupByInfoList.

The ExcelOutlineSummaryRowsLocation is fairly straightforward. I have chosen AboveDetailRows. The other option is BelowDetailRows. If you think about a typically Essbase hierarchy, for example, such as the Time dimension where Qtr1 expands into Jan, Feb, and Mar, then consider Qtr1 as the “summary” and as being “Above” the detail rows (because the children are visibly displayed below it). In the finance world it’s probably more common to have the summary below (common with subtotaling things) but for this demonstration I want them above.

Next we have the GroupStartCell. This is a defined name on my spreadsheet that indicates where the built rows should start being built. In my template, I have it below all of the template definitions but above a row that I will use to total up everything on the sheet (it’s small in the screenshot but see it just above the green rows):

Location of GroupStartCell (StartCell) defined name

Location of GroupStartCell (StartCell) defined name

Row and Group Sorting Configuration

Lastly, I have the RowSortAndGroupByInfoList. The next few configuration screens I am going to show are all have to do with the configuration inside of this setting. You can see that I currently have “2 levels of grouping/sorting defined.” Generally speaking I am going to have a level of sorting/grouping defined for each grouping I do, not counting the base level data. So in this example, I will have three levels of data: by Scenario, by Product, and the data itself, but for purposes of defining the grouping/sorting, this definition pertains to the way that Scenarios are grouped and how Products are grouped within scenarios. As you’ll see momentarily, these levels of grouping correspond one to one with the named ranges/blocks within the Excel template itself. In other words, I will have a named range defining how Scenarios should be displayed, and another range for how Products will be grouped.

Let’s dive into the definition of the Grouping/Sorting dialog:

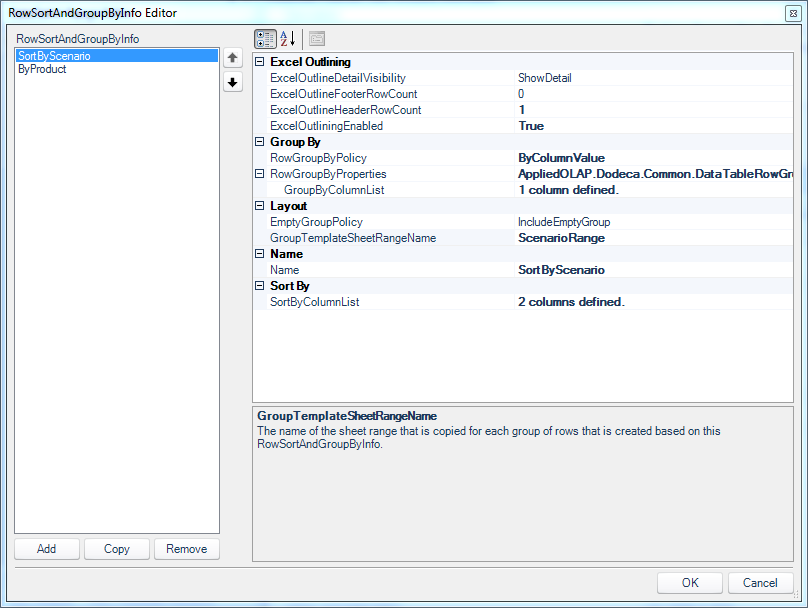
Row sorting/grouping definition, currently focused on Scenario

Row sorting/grouping definition, currently focused on Scenario

First of all, notice that there are two configurations in this dialog (as evidenced by the two entries on the left: one for Scenario and one for Products). The configuration we are looking at right now is for the Scenario groupings.

I’ll move through these configuration values in sequence, starting with the ExcelOutlineDetailVisibility. For this grouping (Scenarios), I have left the default of ShowDetail. This means that by default when the view is built, this grouping will be expanded. So I actually have complete control over how much detail is shown when the view is built. In a moment you’ll see that I choose the HideDetail option for the products, so that they are not shown automatically when the view is built. This is a very nice option to have so that I can choose exactly how much visible information there is for the user when they build the view, without inundating them with everything out of the gate, or forcing them to expand every node manually.

Next up are the ExcelOutlineFooterRowCount and ExcelOutlineHeaderRowCount values. Do you see in one of the earlier screenshots that for every grouping of different Scenario, there is a yellow section on it? In my template, I have defined this section to contain a Total, Count, and Average.

Think about this for a moment.

I’m getting raw data back from a SQL query. As a matter of formatting it into the way I want to see it (and they want I want my user to see it), I have decided that for each group of scenarios, I want to see the total (in this case dollars), the number of detail items, and the average of those detail items. What’s really interesting here is that I didn’t have to go about of my way to do this in the SQL query. In fact, I couldn’t have done this in the SQL query because it wouldn’t let me format and group the data how I wanted to see it and lay it out. What’s happening is that Dodeca is fetching all of that base level detail back, breaking it up into groups that I define, and then using my Excel template to build out the spreadsheet display of that data. And as part of that dynamic build process, I can leverage any functionality I want in Excel in terms of formatting and functions. This is incredible. I’m not beholden to some canned layout, or a couple of pre-programmed functions: I can have it any way I want it.

Now, getting back to the number of the header and footer row count, I can tell Dodeca about how my ranges are formatted (such as how many footer rows I have in this case) so that I have complete control over how the grouping is performed. What I want in this case is that when the groups of scenarios are collapsed, the summary detail (the yellow cells) will be hidden (collapsed into the group). So for this reason, the footer row count is set to 0, essentially meaning that there are 0 rows in the footer that I want Dodeca to leave out of the grouping. To visually display this, consider what my data looks like when I build the view but collapse down to the highest levels (the two different scenarios):

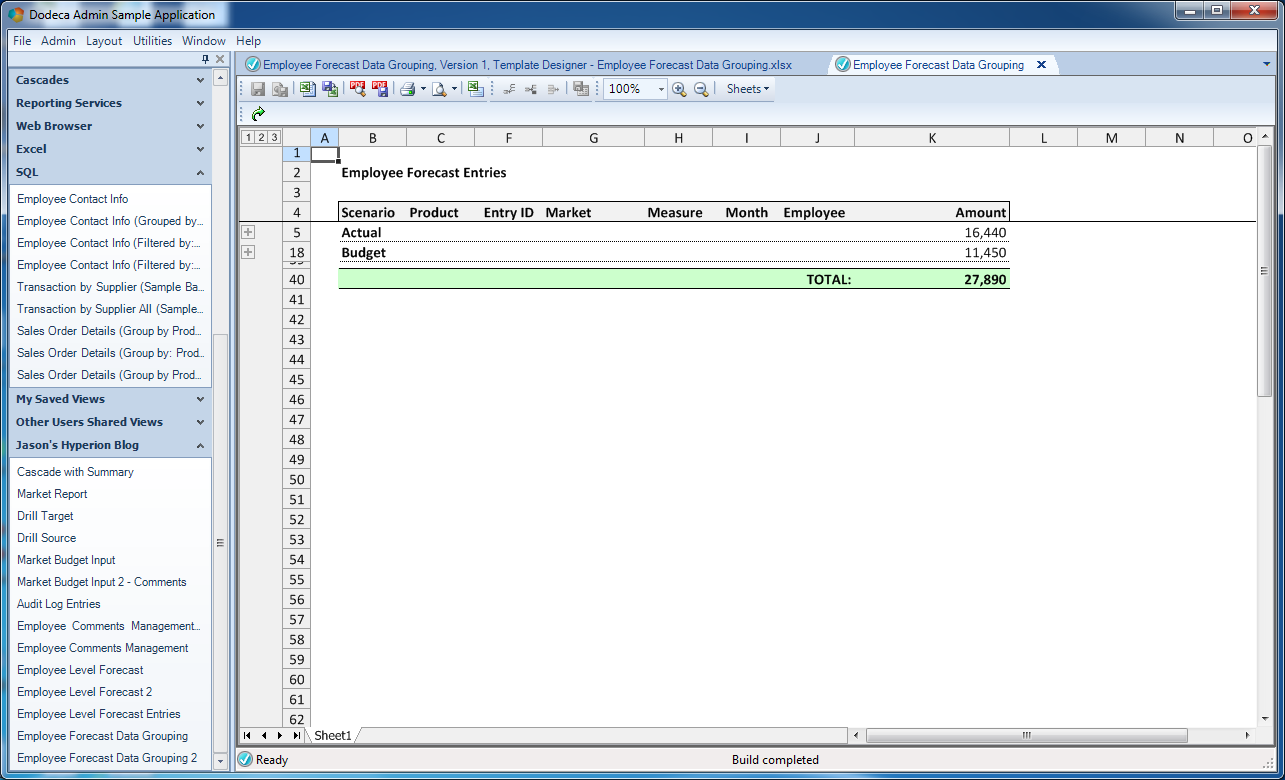
The built view, when its groupings have been manually collapsed to the highest parents (Actual and Budget)

The built view, when its groupings have been manually collapsed to the highest parents (Actual and Budget)

If I wanted Dodeca to set aside some or all of the rows from the scenario summary (again, the yellow cells in this case), I could have set the footer row count to some value such as 3 or 4 so that those rows would still be visible even when the groups are fully collapsed.

Back to the row grouping options and moving ahead, notice that I have ExcelOutliningEnabled set to True. This enables the Excel grouping functionality for the group itself.

Moving forward, we have the options in the Group By category. I can choose my RowGroupByPolicy. I can choose between column values (ByColumnValue) or actually apply a filter on the data. I’m going to cover the more advanced case with a filter in a future article, so for now I am going to do it by value. For this level of grouping (by Scenario), I need to tell Dodeca which columns are in place. You can see in the screenshot that my GroupByColumnList has 1 column defined. Opening up the editor for this, we have the following:

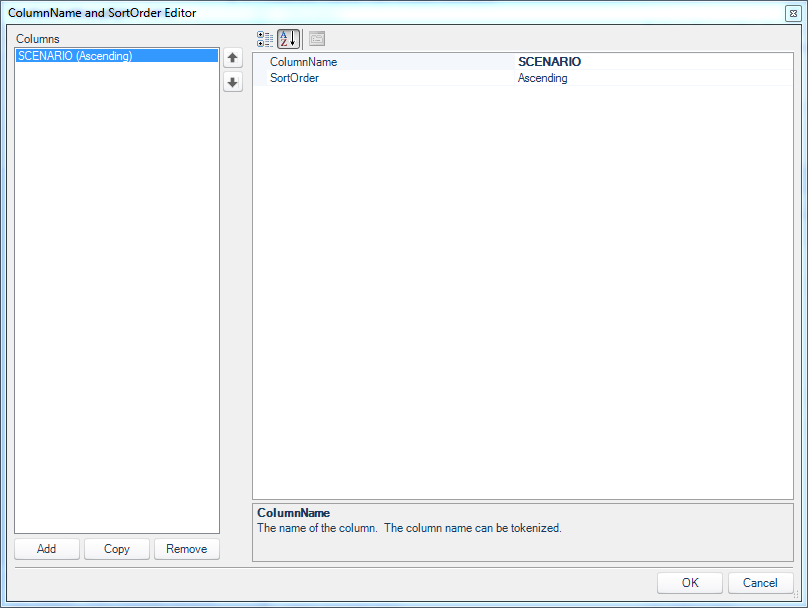
Column definition for Scenario sorting/grouping definition

Column definition for Scenario sorting/grouping definition

This is simple enough. I just have to put in the name the corresponds to the column in the SQL Passthrough DataSet.

Over in the Layout category, I have set the GroupTemplateSheetRangeName to the named range on our Excel template that describes how to lay out groups of scenarios. So our Excel sheet’s “outer” range in this case is named ScenarioRange. Keep this in mind when we get into the layout of the Excel sheet in a bit.

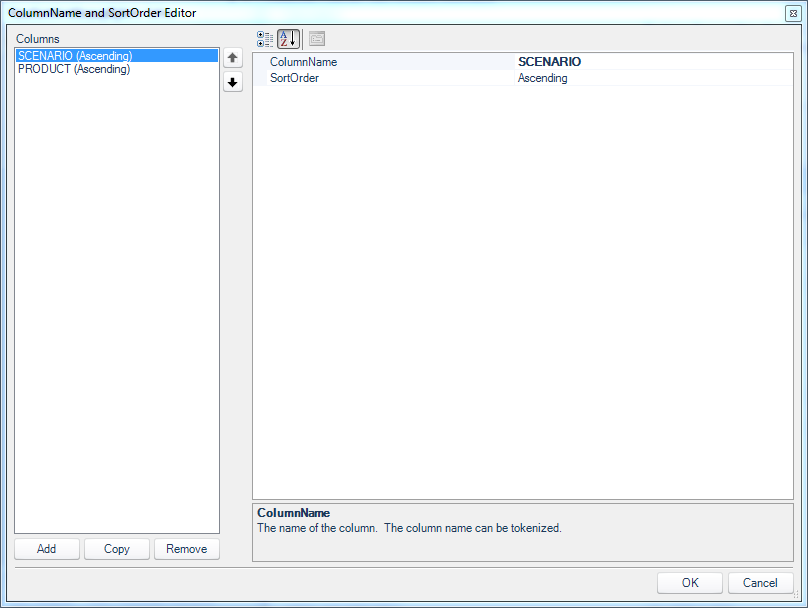
Next, I am going to set the SortByColumnList to explicitly sort the data for me, since it’s not otherwise performed in the SQL Passthrough DataSet itself. The configuration for this is similarly straightforward where we just need/want to sort by the scenario and the product:

Column definition for Product sorting/grouping definition

Column definition for Product sorting/grouping definition

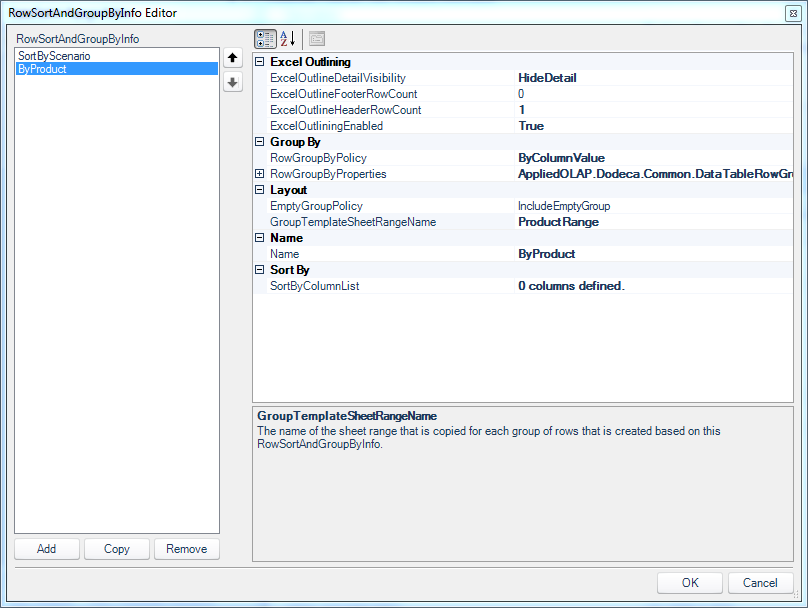
This pretty much covers the configuration for groups of scenarios. Now we just need to do a little configuration for the groups of products that are contained within scenarios. By now this will look a bit familiar. Here is the same dialog from before, but now with the group for products selected:

Row sorting/grouping definition, currently focused on Product

Row sorting/grouping definition, currently focused on Product

Unlike before, I have set the ExcelOutlineDetailVisibility to HideDetail. So when the view is built, I don’t actually want the lowest level of detail shown to the user. Again, outlining is set to True and I have told Dodeca that I have one header row (the summary row with the name of the product itself).

Although not expanded in this screenshot, the RowGroupByProperties contains a single column entry for the PRODUCT column, similar to the definition for the scenario groupings. The last thing to note here is that the group template (named range) on the Excel template will be named ProductRange. You’ll see this as I go through the Excel template in detail.

Okay, that was a fair bit of configuration it will all be worth it when we have that sweet dynamic grouping action helping our users be happy and productive. Let’s turn our attention to the Excel template layout.

Building the Excel Template

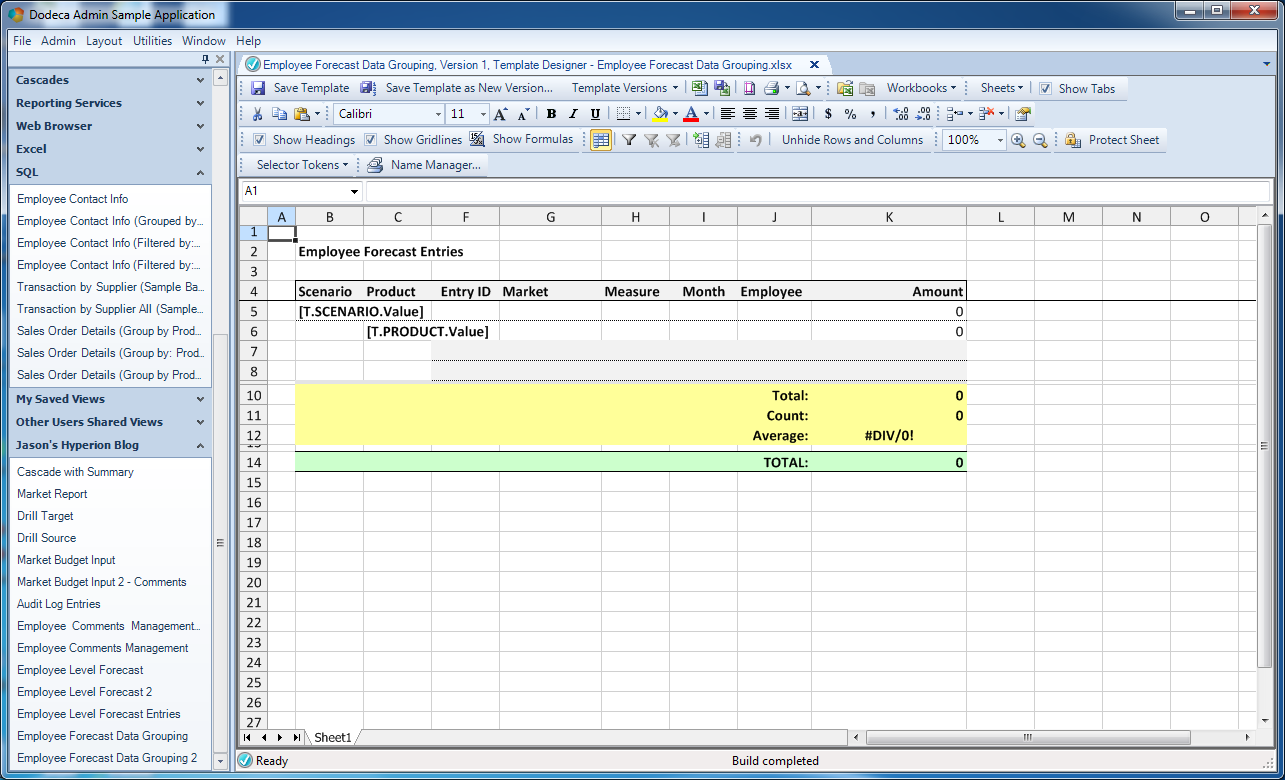
Here’s an overview of the whole template:

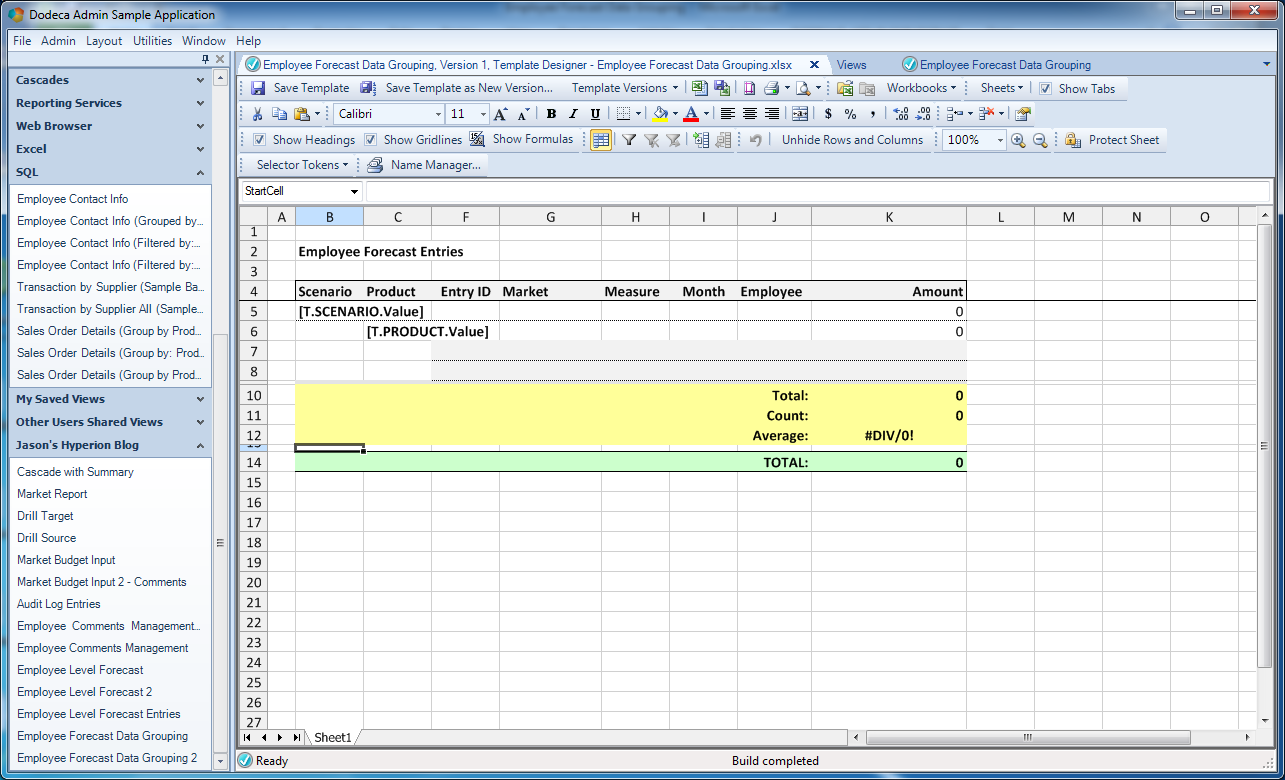
Excel template for the entire scenario/product grouping for the our dataset

Excel template for the entire scenario/product grouping for the our dataset

Some things to note:

  • The top four rows are all static and simply have a visible name for the report and some headers for the column values. After row four I have frozen the panes (Freeze Panes) so that the user can scroll down through the data and keep the header in place.
  • You’ll see that the yellow rows are built for each group of scenarios, and include dynamic subtotals for the total, count, and average
  • The green row is a summary that will be displayed once at the bottom of the entire report

Let’s take a look at the standard named range for the SQL Passthrough DataSet itself:

Excel template defined range for SQL Passthrough DataSet data

Excel template defined range for SQL Passthrough DataSet data

As with previous articles on this feature, this is pretty straightforward. We simply tell Dodeca about a location on the sheet that will be populated with data from the SQL query. There is one cell for each column in the query. Notice that columns D and E are hidden. These simply contained the scenario and product, and I don’t need to display them since they will be contained in headers, so I can just hide them.

The standard named range for a SQL Passthrough DataSet without column headers is two rows high, which is what I have here.

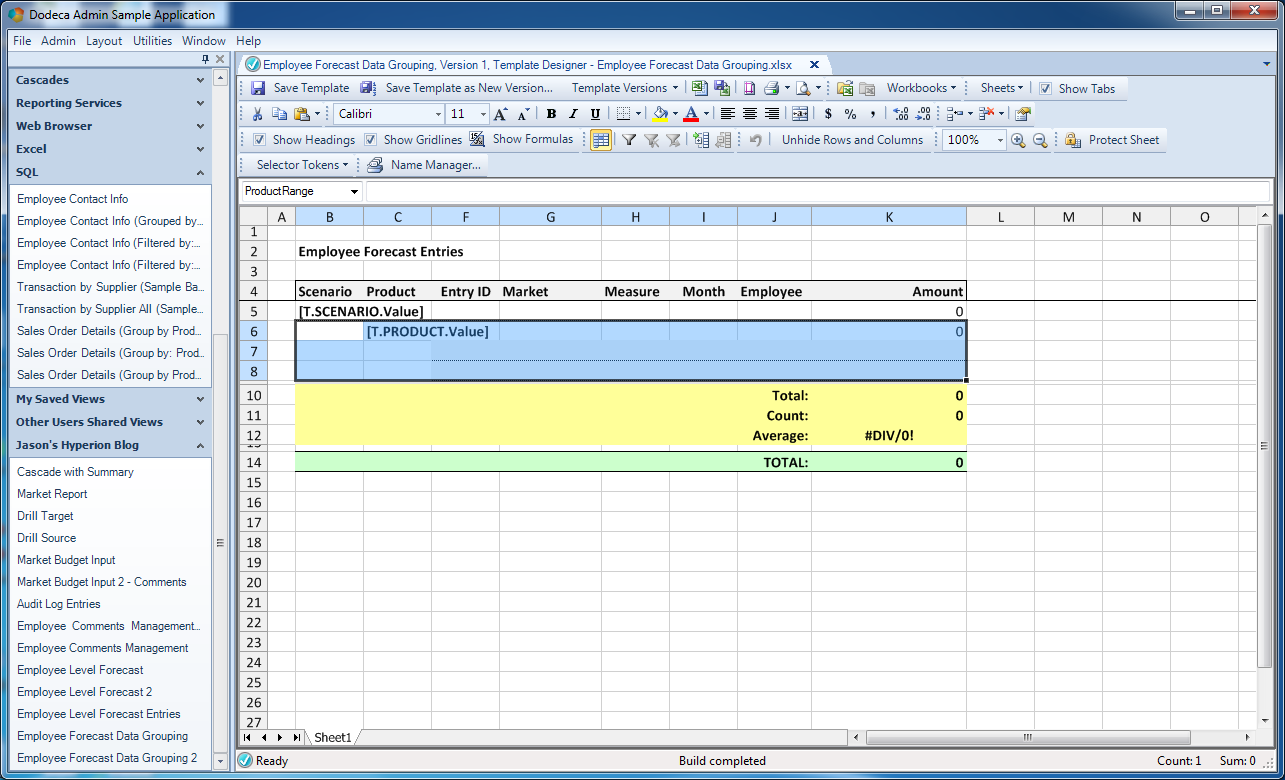
Now things start to get interesting versus previous examples with standard data sets. We are going to look at the way that groups of products will be displayed and built. Here is a named range defining the layout for products:

Innermost grouping range for Products

Innermost grouping range for Products

Notice that this range contains the SQL Passthrough DataSet range in it. Also notice that I have a special token at the top, [T.PRODUCT.Value]. It’s special because it let’s us get the value of the PRODUCT column and place it into the row. So in this case that’s going to be either Cola, Diet Cola, or whatever the product for the grouping is. This saves us from having to try and do some Excel formula trickery to try and grab the value of the first data row or something. Lastly, you can see that the name of this range is ProductRange and corresponds to the range in our configuration in the view earlier.

Next is the definition for the Scenario range:

The outermost grouping template for different scenarios

The outermost grouping template for different scenarios

Notice again that this range contains both the product range in it as well as the SQL Passthrough DataSet range. The additional nuance here is that I have a few additional rows for Total, Count, and Average. I’ll be using the Excel SUBTOTAL function in these so that I can accurately and dynamically perform these operations based on the data in the Excel groups (without double-dipping or over counting a value).

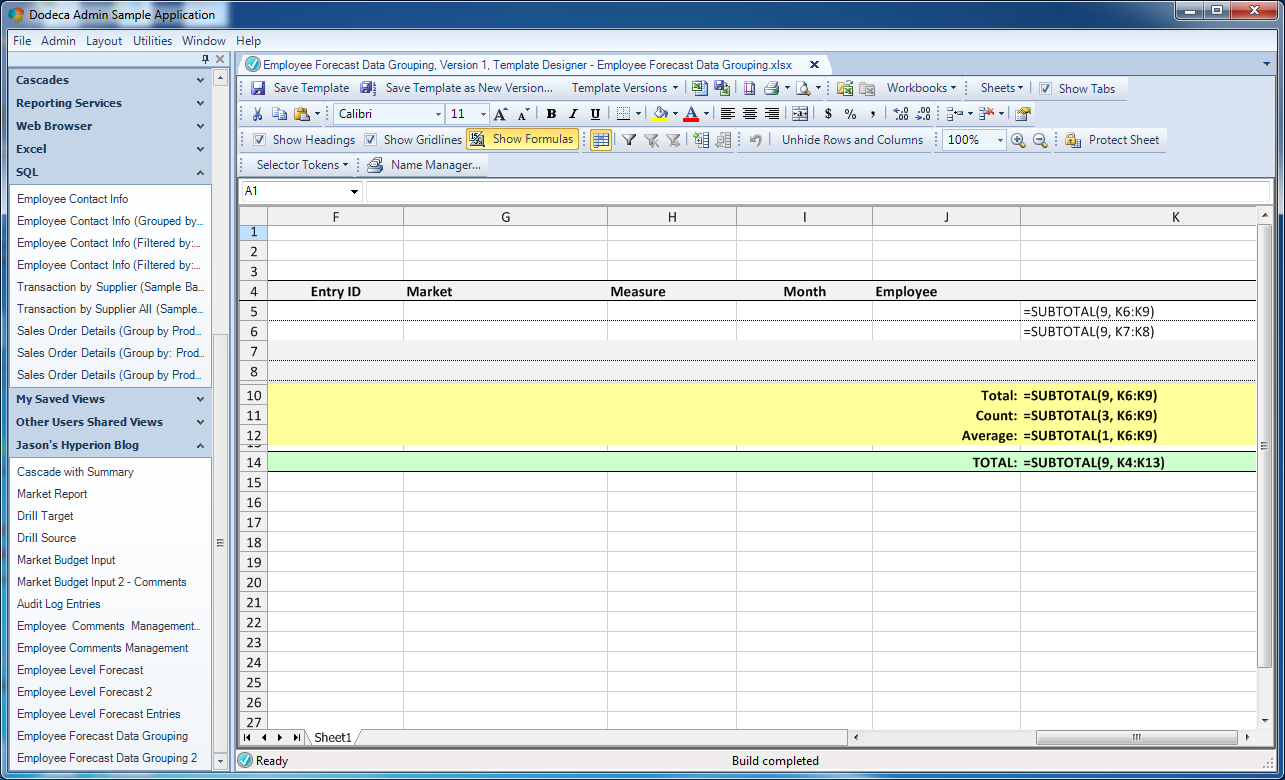
Now, remember that just the raw data is coming back from the SQL query with no totals or groupings of anything. So I’m going to lean on Excel to calculate these for me. As such, I need to plugin the appropriate formula in the right spot and referring to the proper cells, so that when Dodeca fetches and groups the data, the cell references get expanded accordingly and refer to the proper things. I am going to place these formulas in strategic locations within these named ranges so that they will calculate based on the data within the range, giving me the subtotals or whatever values I want. So let me toggle formula display on and show you what I have:

Excel template with formulas shown

Excel template with formulas shown

So here we see that I have SUBTOTAL formulae (ooh, fancy) for each group of scenarios (this is the formula in K5, group of products (K6), and my Total/Count/Average in K10, K11, and K12 respectively.

Check out the addresses for these formulae, though. You can see that for the groups of products, I am referring to K7:K8. This corresponds exactly to the two rows contained in the range for the SQL Passthrough DataSet. Remember that InsertCells flag I mentioned earlier? When Dodeca builds this view and adds in rows from the SQL query, it’s going to perform a normal spreadsheet row insert. As such, the formulas referring to those cells will be dynamically adjusted. In effect, the range referred to by the formula will be taller, and capture the additional rows that get inserted.

The range referred to for the scenario grouping is a bit taller (K6:K9). It needs to be taller to start with so that the cells/rows getting expanded for the row build will actually be in the range that the subtotal calculates for. Notice that the range for the Total/Count/Average is the same.

Lastly is the overall formula for the entire report. This one has the widest range of all and is set so that when the entire grid is expanded, it will capture everything in it.

As a quick aside on the awesome SUBTOTAL function, it is smart enough to calculate things for me without double counting them. If I was just using SUM I’d be adding up too much – the base level data plus the intermediate subtotal values. Also, note that the first argument to SUBTOTAL defines the aggregate function to perform. The value of 9 means SUM, 3 means COUNT (COUNTA to be precise), and 1 means AVERAGE. There are numerous other functions available and supported (such as standard deviation and more).

Putting It All Together

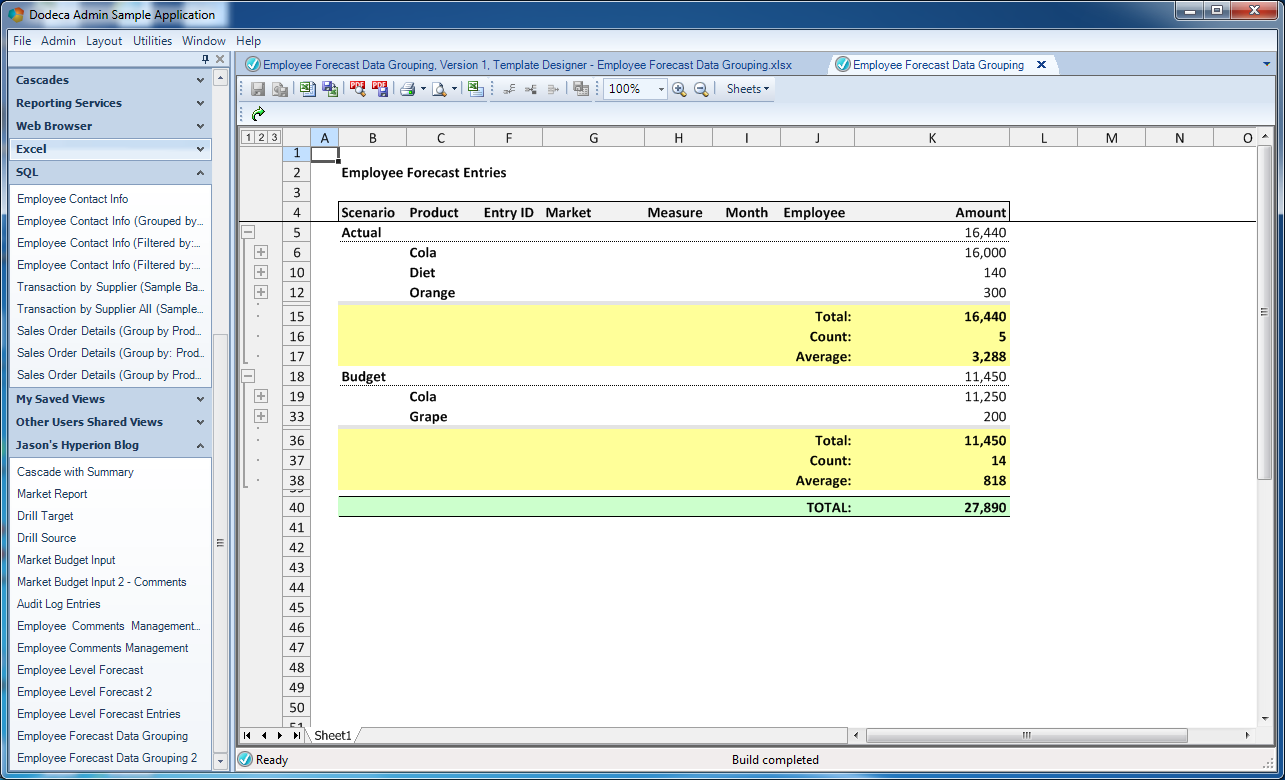
Now for the moment of truth: we’ve defined the SQL query, configured the view, and built the template. Now for the Dodeca pixie dust engine to put it all together. Let’s see what we get:

The built view expanded to its second level of detail

The built view expanded to its second level of detail

Everything looks good! Per my view definition, the report was built, I have one group per scenario, the product level detail is hidden by default, and I have a subtotal for the entire report (green row).

Let’s say as the user that I actually only want a higher level of detail. I can collapse the groups manually (by clicking on [-] everywhere), or just click on the [1] in the top left corner, indicating that I want to collapse the entire report down to the first level of grouping:

The built view, when its groupings have been manually collapsed to the highest parents (Actual and Budget)

The built view, when its groupings have been manually collapsed to the highest parents (Actual and Budget)

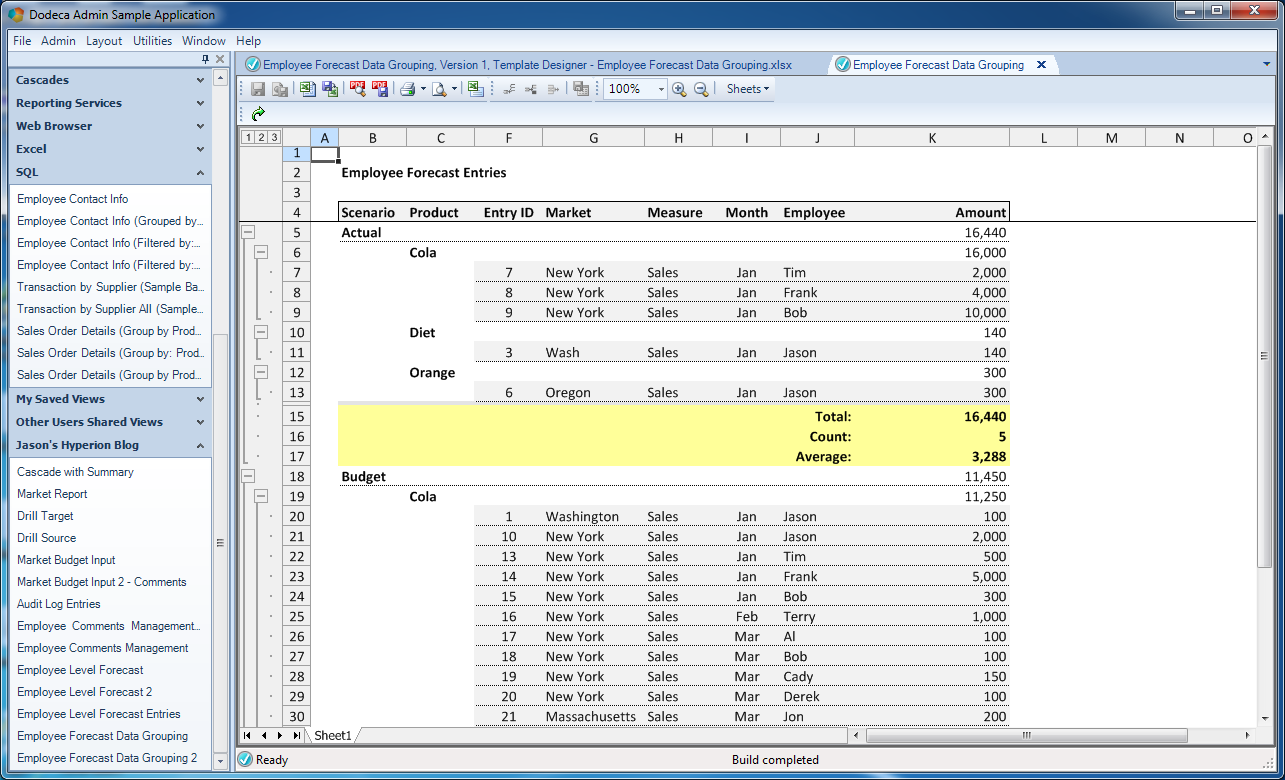
Alternatively, let’s say that I want full details for everything. I can expand everything or just click on [3] and expand out to the full details:

The built view expanded to all levels of detail, in this case 3

The built view expanded to all levels of detail, in this case 3

Let’s scroll to the bottom so I can checkout the page total plus the frozen panes in action:

The built view, expanded to all details, scrolled to the bottom to show dynamic totals

The built view, expanded to all details, scrolled to the bottom to show dynamic totals

And lastly, let’s bring everything full circle and go ahead and click on the Excel button to instantly open this in Excel, revealing that it is, in fact, using native Excel grouping functionality and that the user can do anything they want to it in Excel, or maybe just email it to someone:

Dodeca dynamic grouping opened up in Excel

Dodeca dynamic grouping opened up in Excel

Summary

I hope you enjoyed this overview of Dodeca’s innovative and powerful grouping functionality. In addition to Essbase being a first-class citizen in Dodeca, so are relational databases. The amount of configuration and flexibility available to us is immense, allowing us to very specifically format reports and data that will benefit our users the most. My favorite aspect of this exercise (other than the fact that we achieved such incredible formatting with no code at all) are the summary rows by scenario. Without having to mess around with SQL functions (or even multiple queries), we were able to pull back the data and show it in a completely arbitrary way that is most useful to our users. I think this stands in contrast to many tools that  force you to work with the data in a way that is more aligned the data. As I’ve said before, we should be able to adapt the tool to our business process – not the other way around.


Data Input with Dodeca, part 6 – SQL and Essbase Hybrid Input in one View

The last article on relational data input with Dodeca was a bit epic – I was planning on something a little shorter and sweeter for this next article, but it’s going to be another long (but awesome!) one that combines everything we’ve seen so far in this data input series, and more. To recap, the series so far has consisted of the following articles:

Let’s get crazy today with a soup to notes implementation where we’ll input relational data and then load it to Essbase automatically so that the data ties out. You might call this “home-brew hybrid”. As with before, it’ll be based on our favorite database in the whole wide world, Sample/Basic.

Consider the Sample/Basic dimensionality: Year (time periods), Scenario, Market, Measures, and Product. The use case that I’m going to look at today will cover the scenario where we want to prepare a budget, by product, by time period, by region, but have it be by employee. But this dimension doesn’t exist in the cube – no problem! Let’s further stipulate that for either architectural, performance, or other reasons, we absolutely do not or cannot put in an Employee dimension. So what we’re going to do is have Dodeca facilitate inputting data by employee and feed that into a relational database, then we’re going to use some simple Dodeca automation (workbook scripts) to take the sum of the data we input (for the given time period and market and so forth), send it up to Essbase, do a focused calculation on the cube, and then retrieve the updated data to show on the exact same sheet that we’re already on.

Adapt the Tool to Your Business, Not Your Business to the Tool

I think it’s worth pointing out that that the basic foundational element in Dodeca – the venerable spreadsheet – is an almost infinitely flexible canvas upon which we base our reports. There is a lot of software out in the world that gives you enhanced productivity (versus rolling your own solution from scratch) but imposes certain constraints on your solution. For example, consider two different software applications for the task of writing a résumé: Microsoft Word versus some specific resume-writing software. Microsoft Word is the “infinitely flexible” option: it can write résumés, letters, reports, shopping lists, or whatever. On the other hand, the special résumé-writing software might make it really easy for the user to crank out a good looking résumé in short order, perhaps choosing from several template options (to be fair, Word has some built-in functionality and templates for résumés too but let’s pretend that doesn’t exist or that the special software is otherwise still more productive and compelling). The specialized software, however, is going to have a more limited number of use cases. So it’s up to use – the users, the admin team, whatever – to decide what we want: the generic software, the special software, or both.

As it pertains to Dodeca, however, the central spreadsheet paradigm gives us this infinitely flexible environment to work in while simultaneously letting us an astounding amount of experience with spreadsheets and Excel. And I think this hybrid input example is a particular poignant demonstration of this power: we are not limited to a single technology in a sheet, or a single connection. Dodeca let’s us seamlessly blend Excel functions, formatting, SQL retrievals, SQL input, Essbase retrievals, Essbase input, a procedural scripting tool, and more, all in a single view.

So rather than having to arbitrarily break this business task up for technical reasons – perhaps into multiple views, multiple steps, whatever – we can easily design it exactly the way we want the user experience to be.

Concepts & Techniques

This post is going to show off a lot of Dodeca features and techniques. In no particular order:

  • SQL data on a view (SQLPassthrough Data Sets)
  • Essbase retrieval data on same view
  • Sending data back to relational database
  • Selectors allowing only certain members to be used (such as only level-0 members)
  • Excel formatting
  • Hidden send range on sheet
  • Hiding rows/columns
  • Cell references to link data between locations on a sheet
  • Workbook Scripting to automate data submission task
  • Automatically executing a server-side calc script
  • Using a custom POV to focus the calc script
  • Hiding rows with Essbase member names in order to show a “nice” name instead

Let’s Do This

The following sequence of screenshots and text is going to describe the start to finish (or soup to nuts) process of creating the desired view of data in Dodeca. Parts of this will overlap with the earlier posts in this series.

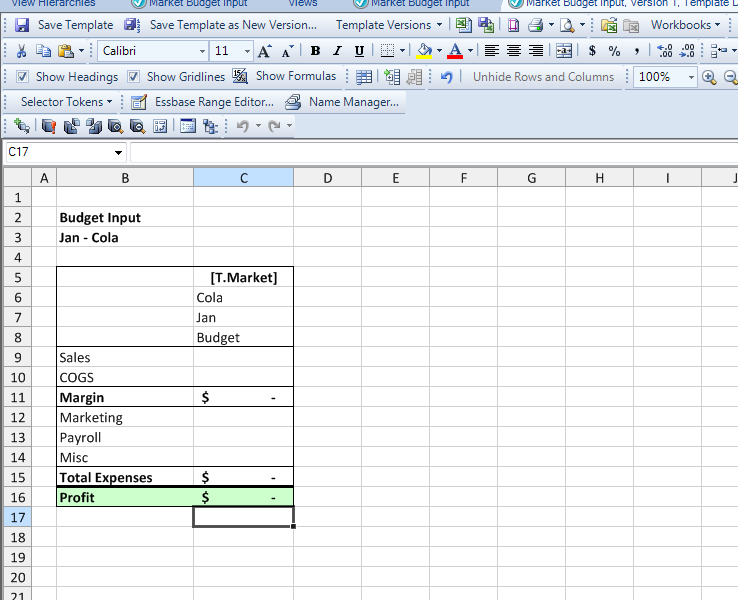
First thing’s first, we will start with our basic template. It’s going to look a little weird at first, but hang with me and I’ll lay out where everything goes, why it goes there, and toward the end we’ll totally clean it up into a really nice looking, highly functional view. Here’s the basic template that I whipped up to start things off:
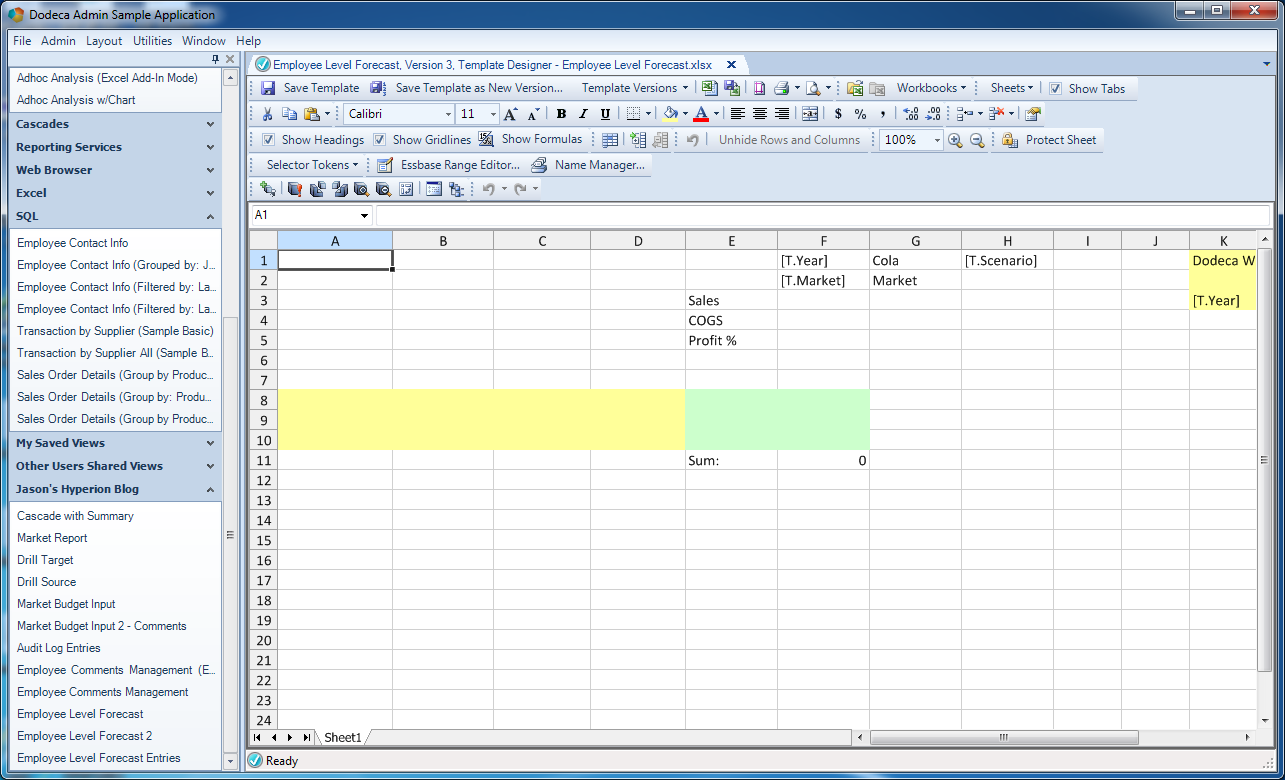
Initial Dodeca hybrid input template

Initial Dodeca hybrid input template

You can’t quite see it yet (I’ll go over it in the next few steps), but there are three “sections” in this template. This first section (range) I want to bring your attention to is the normal Essbase retrieve range:
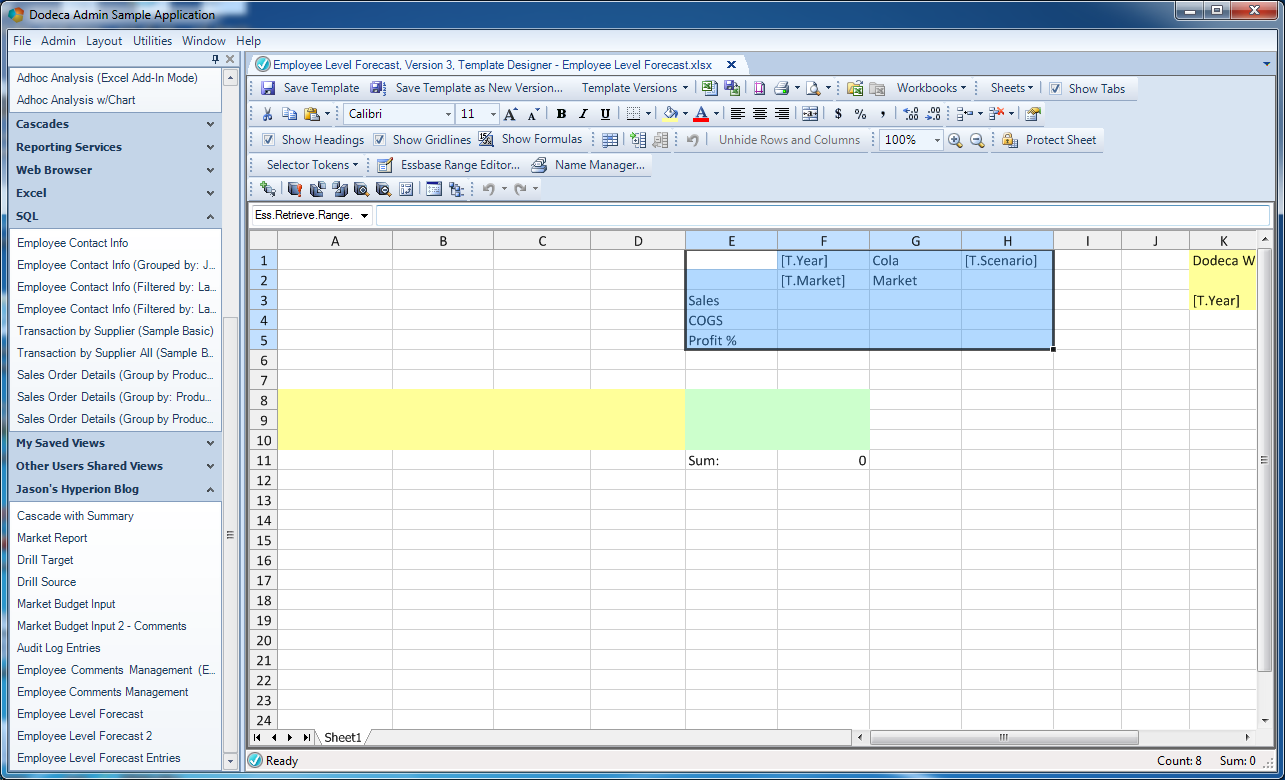
Essbase retrieve range on Dodeca template

Essbase retrieve range on Dodeca template

This is the part of our template that is more or less just a straight pull of data from Essbase. When the view is built, the range is retrieved (using the user’s selected values for the Year and Market dimensions), showing what the current values are in Essbase. This template itself is going to be used to update that very same data, so where we’re going with this article is that we are going to input data in the SQL/relational range, send the sum back to Essbase, then immediately retrieve it. The user won’t be entering any data directly into this range.

I want to point out specifically a couple of other things about the dimensions for this example. As I just mentioned, the Year and Market dimension members will be chosen by the user. As you’ve seen in other articles, the user-chosen values will be populated for the tokens T.Year and T.Market. But also notice that there is a token for the scenario ([T.Scenario]). I’m going to get into this later in the post, but this is actually going to be token that is specified on the view itself. In other words, I don’t need (or want) the user to choose the scenario, since on this input template it’s just always going to be Budget. So I can just plug it in at the view level.

Lastly notice that I decided to hard-code the product. This is purely for illustrative purposes where we’ll also make the assumption that these users are perhaps in the Cola division and this dimension will always have the value of Cola. It’s much more likely that in reality this would be configurable, but as you’ll see in the upcoming queries and other functionality, I wanted to show a nice blend of hard-coded values, selector values, and dynamic tokens/placeholders to give you a feel for what the possibilities are.

The second of three sections on this sheet is an Essbase send range, shown in yellow:
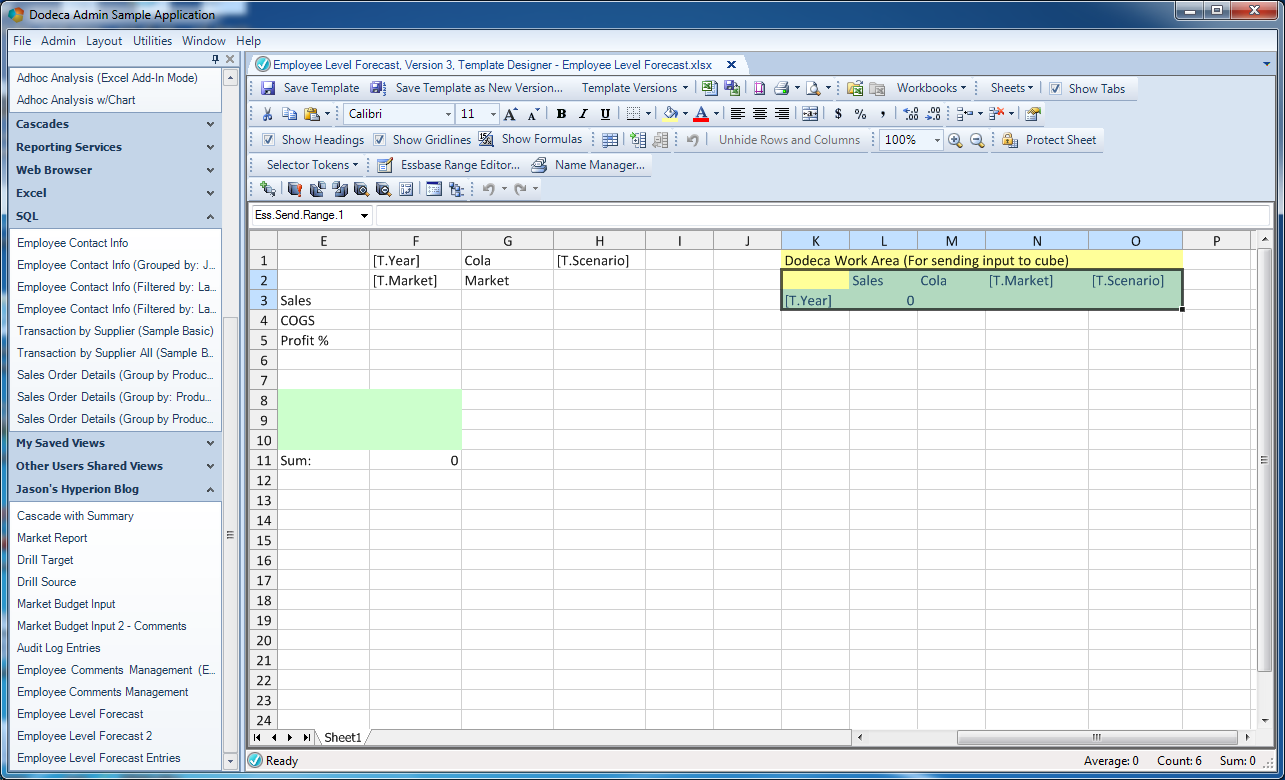
An Essbase send range

An Essbase send range

This range is purely a “work area” for us – it’ll never be shown to the user. This is a very common Dodeca technique where we leverage all of the power and functionality of spreadsheets to compute something, and then “do something with it”. Another way to think about it, perhaps, is that as opposed to needing to learn some custom scripting language, or the Java API, or whatever, our solution/view architecture borrows concepts that we are already very familiar with (thereby decreasing the learning curve and enhancing productivity). In this case, we can think of our goal simply as wanting to somehow create a normal lock and send data submission grid, then send it up to the Essbase server.

As with before, the send range is named (Ess.Send.Range.1) according to Dodeca’s expectation of named Essbase send ranges (i.e., a range with a name starting with Ess.Send.Range. will be automatically recognized as needing to be retrieved against an associated Essbase cube).

The third section of note on the Dodeca template is a range for the SQL data (our SQLPassthroughDataSet), and is given an arbitrary name (in this case, EmployeeForecast):
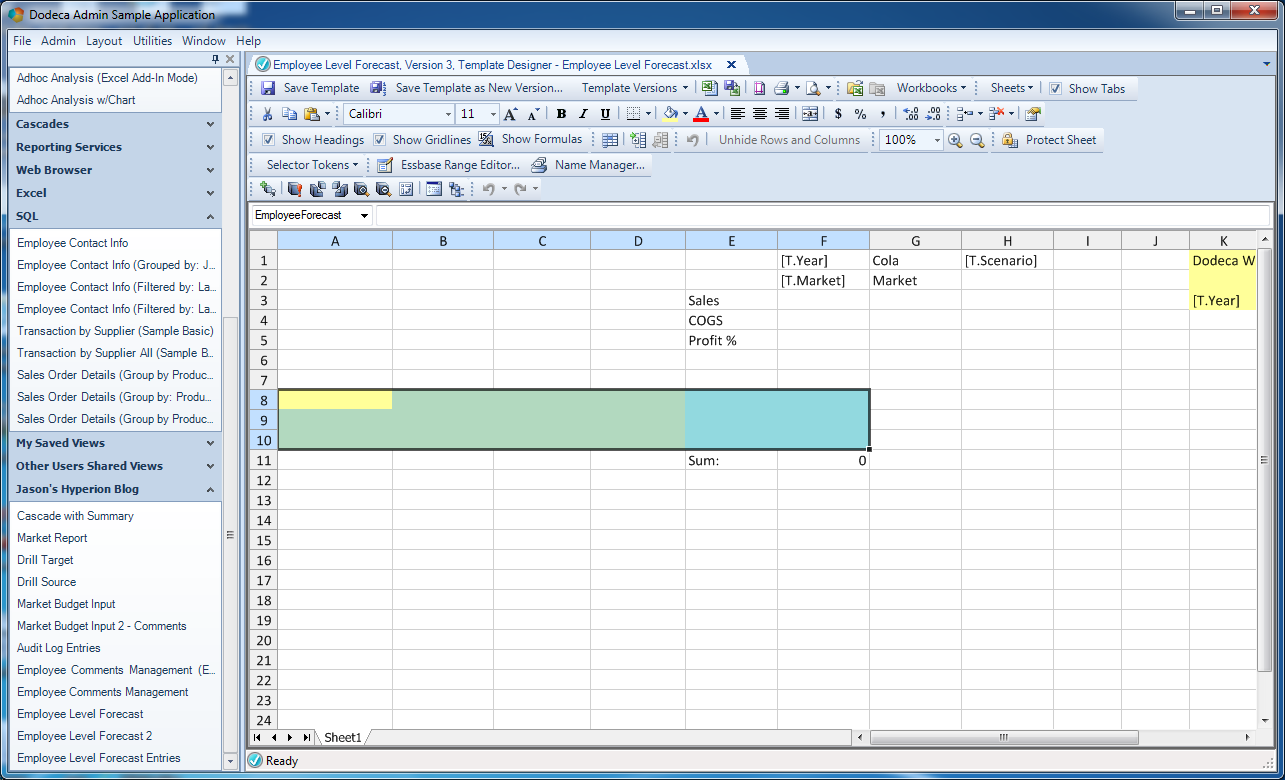
SQL input range

SQL input range

As you’ll see momentarily, the actual number of columns that we are going to show to the user is two (the employee name and the amount). The other columns are going to be hidden from the user. These hidden columns include the primary key (an integer), the market, time period, and product. In this case all we really need is just the primary key (so that Dodeca can identify a particular row in the dataset), the employee, and the amount, but rather than create a new query object (with fewer columns), I opted to just leave the extra columns in and just hide them for the final template. Either way works just fine, although with this technique I could potentially reuse the SQL query object more easily on some other sheet.

Before moving on, take a look below this SQL range, at cell F11. It currently shows a value of 0. This cell’s value is actually a formula: SUM(F9:F10). Although it is 0 in this admin view of the template, when data is loaded from the SQL table, it will fill the columns, and the cell with the sum formula will update, simply by virtue of being an Excel formula. Further, the way that rows will be inserted into our our range is via inserting a row, and again, leveraging the way that Excel inherently works, the range referred to by the sum cell will naturally grow to include the new rows, with no magic or code needed on out part.

With the template roughly laid out, we can now turn our attention to the SQL Passthrough DataSet. For an introduction to how these work, feel free to check out the previous article about relational data input with Dodeca. In a nutshell, however, think of a Dodeca SQL Passthrough DataSet as a smart definition of SQL data (using a particular and defined SQL connection) that at a minimum knows how to SELECT certain rows from a table/view, and optionally can be configured to know how to insert, delete, and update new rows. We define all of this behavior in a given SQL Passthrough DataSet object, and can then leverage this definition across a single view or multiple views. Over on the SQL Passthrough DataSet management interface, you can see that this one has one particular query defined, and three test tokens (more on that in a moment).
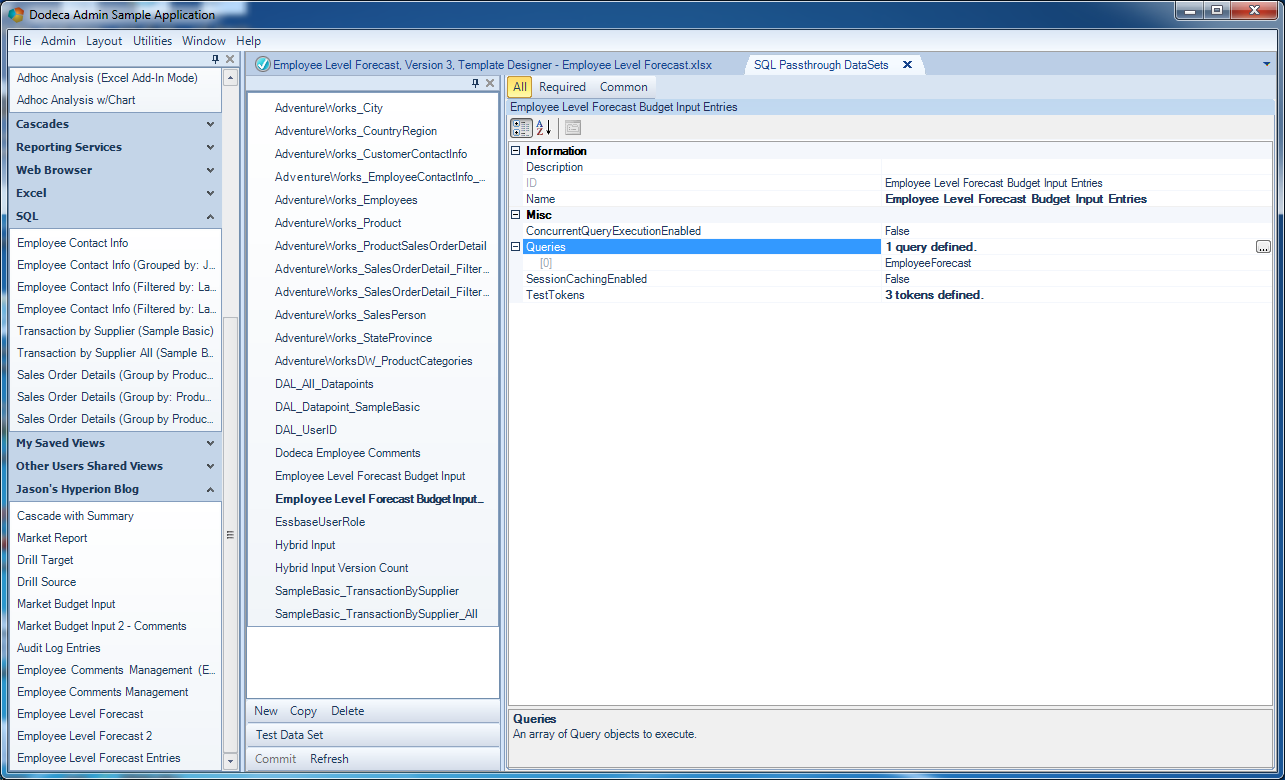
SQL Passthrough DataSet configuration

SQL Passthrough DataSet configuration

Opening up the query definition for this SPTDS, you can see that the SQL connection has been configured (simply chosen from a list). In this case I have also mapped out the columns with data types, and defined the primary key. Some database types don’t need this to be configured manually, but it doesn’t hurt to define it. Next, note that there are queries defined in the SQL category (DeleteSQL, InsertSQL, SelectSQL, and UpdateSQL). These are usually tokenized/parameterized queries that Dodeca uses in conjunction with the tokens from our view (selectors, view tokens, application tokens) to execute queries. You might be thinking that it’d be nice if you could just give Dodeca the name of a table and be done with it. But the act of updating a table can and usually does have quite a few nuances, particularly in terms of which columns should be updated, with what, what default values there are, and so on.
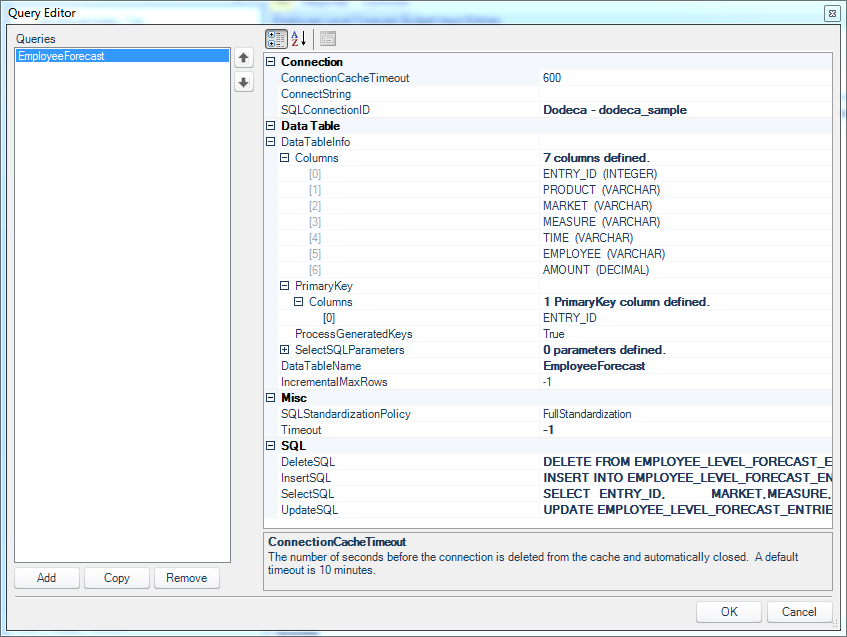
Query editor for Employee sales dataset

Query editor for Employee sales dataset

Let’s go through the definition of each query. To start off with, check out the DeleteSQL query:
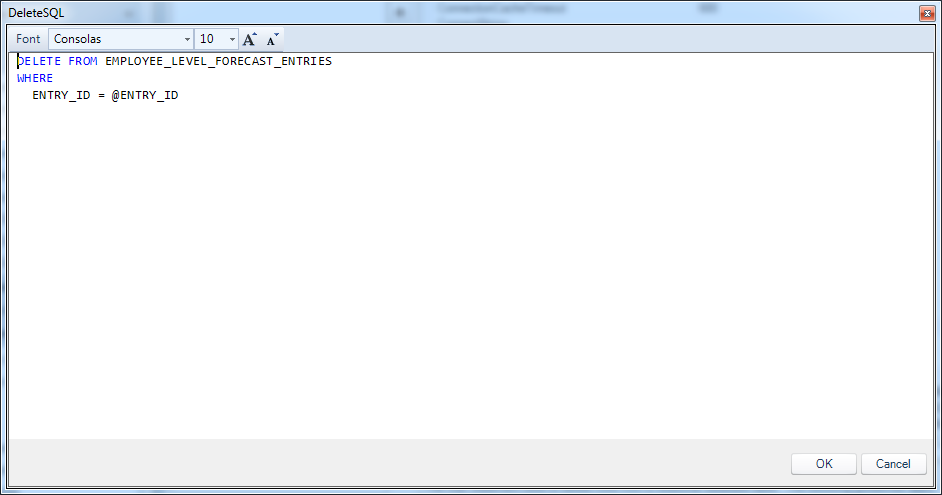
Employee sales forecast delete query

Employee sales forecast delete query

For completeness, here is the SQL code in text form:


DELETE FROM EMPLOYEE_LEVEL_FORECAST_ENTRIES
WHERE
    ENTRY_ID = @ENTRY_ID

The DELETE query is pretty simple. The only thing we need to do to delete a column is to identify it by it’s primary key value. You’ll notice the special @ENTRY_ID token. This is not to be confused with a normal view token in Dodeca. This is a token value that comes from the data table on the view itself. Dodeca knows each column in our dataset, and we can refer to any value we need by using the @TOKEN_NAME syntax. And that’s exactly what we’re doing here. When/ the user selects a given row and clicks on the delete toolbar button, a string of actions is kicked off, but at the most basic level, what happens is that Dodeca takes the context of the current row (the column name to value associations), then runs the DeleteSQL query, having plugged in the appropriate values in the placeholders.

Now let’s take a look at the InsertSQL configuration:
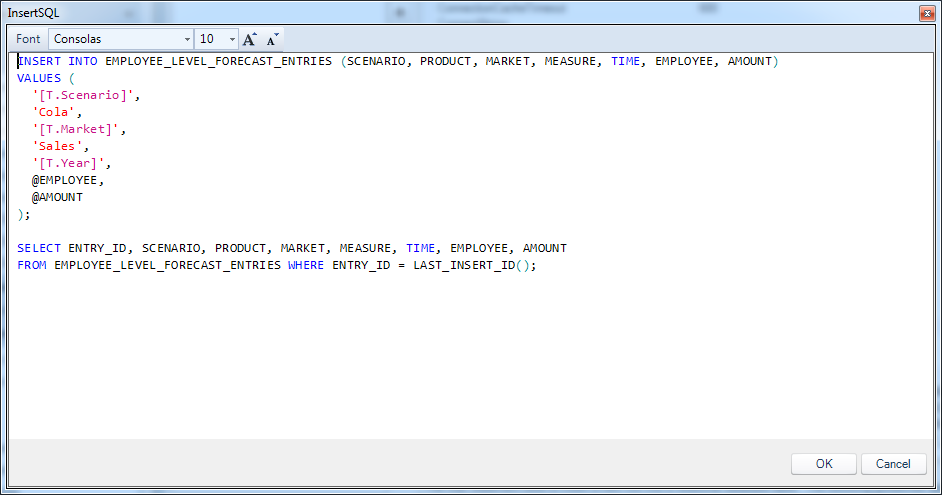
Dodeca insert and post insert statements

Dodeca insert and post insert statements

The code:


INSERT INTO EMPLOYEE_LEVEL_FORECAST_ENTRIES (SCENARIO, PRODUCT, MARKET, MEASURE, TIME, EMPLOYEE, AMOUNT)
VALUES (
    '[T.Scenario]',
    'Cola',
    '[T.Market]',
    'Sales',
    '[T.Year]',
    @EMPLOYEE,
    @AMOUNT
);

SELECT ENTRY_ID, SCENARIO, PRODUCT, MARKET, MEASURE, TIME, EMPLOYEE, AMOUNT
FROM EMPLOYEE_LEVEL_FORECAST_ENTRIES WHERE ENTRY_ID = LAST_INSERT_ID();

This is the most interesting query of all of the configured queries. There are actually two queries here – the main INSERT query, followed immediately by a “post-insert” query. I talked about this a little bit in the last post as well, so for more details (also regarding some of the nuances between primary keys in Oracle vs. SQL Server vs. MySQL) check there. Let’s start with the INSERT query.

Again, our table has a primary key (an automatically incrementing integer value), and several columns. When we perform an insert, we are going to use normal SQL syntax to simply specify each column, but we’re not going to specify anything for the primary key column (ENTRY_ID). This is basically us saying that we want to let the database engine plug in a value for us automatically. Next, notice the corresponding VALUES that are to be inserted. I have three different types of things here: hardcoded (literal) values (such as Cola and Sales), selector token values ([T.Market], [T.Year]), a view token ([T.Scenario]), and SQL DataSet tokens (@EMPLOYEE, @AMOUNT).

As with the DeleteSQL configuration, when a user inserts a row to the table and saves it, Dodeca takes the current selector token values, the current view token values, the context from the SQL table, plugs them in to the query, and executes it.

As a somewhat special nuance to our InsertSQL configuration, we have a semi-colon delimiting the INSERT query and our “post-insert” query. The post-insert query is specifically crafted (in this case, it’s particular to the MySQL database semantics, what with the MySQL-specific LAST_INSERT_ID() function). Dodeca will immediately execute this statement so that it can fetch back the value that was generated for the primary key by the database. This is necessary in order for Dodeca to properly marry up the data on the grid with the data in the table (in other words, Dodeca needs a way to associate the grid data to the data in the table via the new primary key).

Moving on, let’s take a look at the SelectSQL configuration:
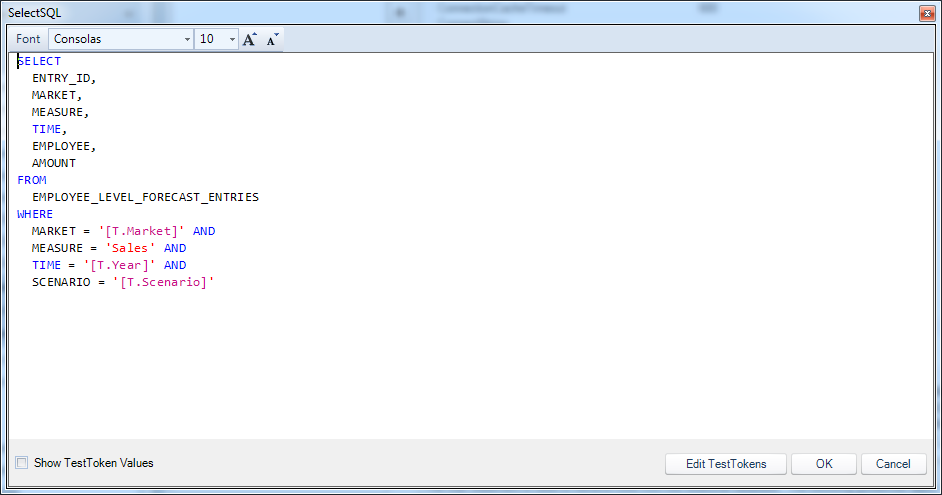
Employee forecast SELECT statement

Employee forecast SELECT statement

The SELECT statement code:


SELECT
    ENTRY_ID,
    MARKET,
    MEASURE,
    TIME,
    EMPLOYEE,
    AMOUNT
FROM
    EMPLOYEE_LEVEL_FORECAST_ENTRIES
WHERE
    MARKET = '[T.Market]' AND
    MEASURE = 'Sales' AND
    TIME = '[T.Year]' AND
    SCENARIO = '[T.Scenario]'

The SELECT SQL can be thought of simply as the query that returns the data you want to show in the table. This will often (but not always) be written to include one or more tokens from the selectors on the view. In this case, I’m narrowing the query to bring back just data relevant to the current market, time period, and scenario (again, using the two selector-based tokens of [T.Market] and [T.Year], and the view token [T.Scenario]).

Lastly, we need just one more query in order to be nice and full featured, and that’s the UPDATE query:
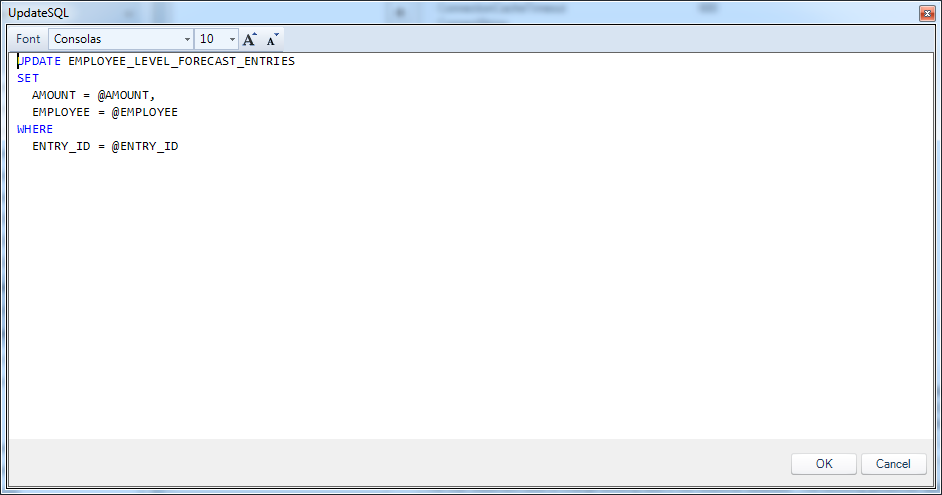
Employee forecast update statement

And the code one more time:


UPDATE EMPLOYEE_LEVEL_FORECAST_ENTRIES
SET
    AMOUNT = @AMOUNT,
    EMPLOYEE = @EMPLOYEE
WHERE
    ENTRY_ID = @ENTRY_ID

The update query generally identifies a particular row by way of its primary key (WHERE ENTRY_ID = @ENTRY_ID), and only updates values that have changed or otherwise need to be changed. In this case, we only need to update the AMOUNT and EMPLOYEE column values, because in this view, we’re effectively saying that a user can’t just change the market, time period, or scenario of a a given row (there are cases where we might want to do that, of course, in which case, we might configure the SQL a little differently or perhaps use a small script to handle the data movement/reclassification).

Okay, that’s a good bit of configuration for our SQL Passthrough DataSet. The really nice thing about this architecture is that we can reuse this same definition across multiple views, which will save us time down the road, in addition to increasing maintainability.

Before moving on, it will be good to test the data in the data set. Of course, since the SELECT query references token values, we’ll need to provide some values for Dodeca to test with. This is easily accomplished with the relatively new Test Tokens functionality. This functionality allows us to define (and save) sample values for any number of tokens, such that they will be used when we preview the data set. Here’s my definition of test tokens:
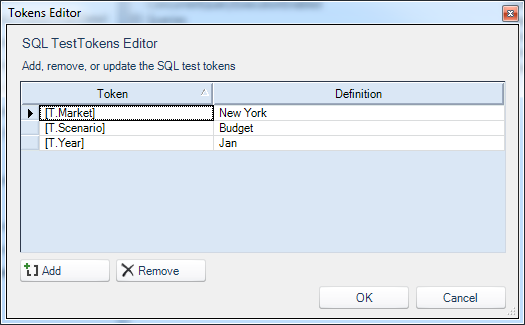
Test tokens for SQL query

And when I click on the Preview button, I get this data from the table, using the tokens I just defined to execute the sample query:
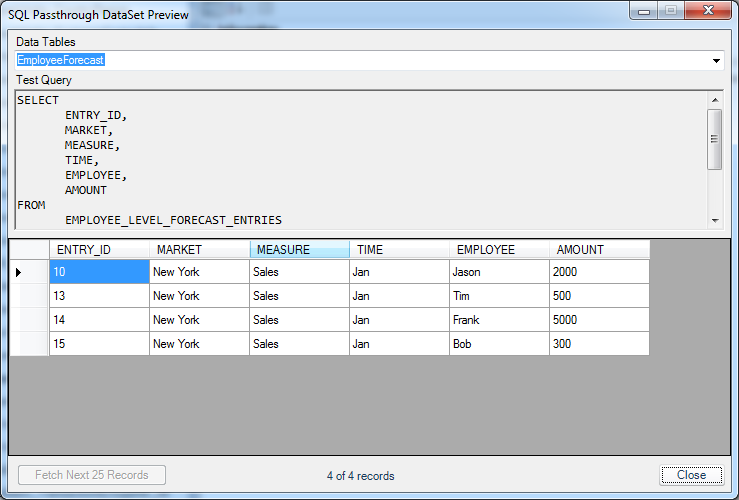
Employee forecast DataSet preview

Employee forecast DataSet preview

The query executed successfully, so things are looking good. This is a good chance to make sure the basic plumbing of the view is working, without having to copy/paste it into a SQL tool or something else.

Having already defined the view template, it’s time to dial in the options for the view itself. Generally speaking, the default values for a view are pretty sensible, but it will be useful to change a few things. Consider this first section of view options:
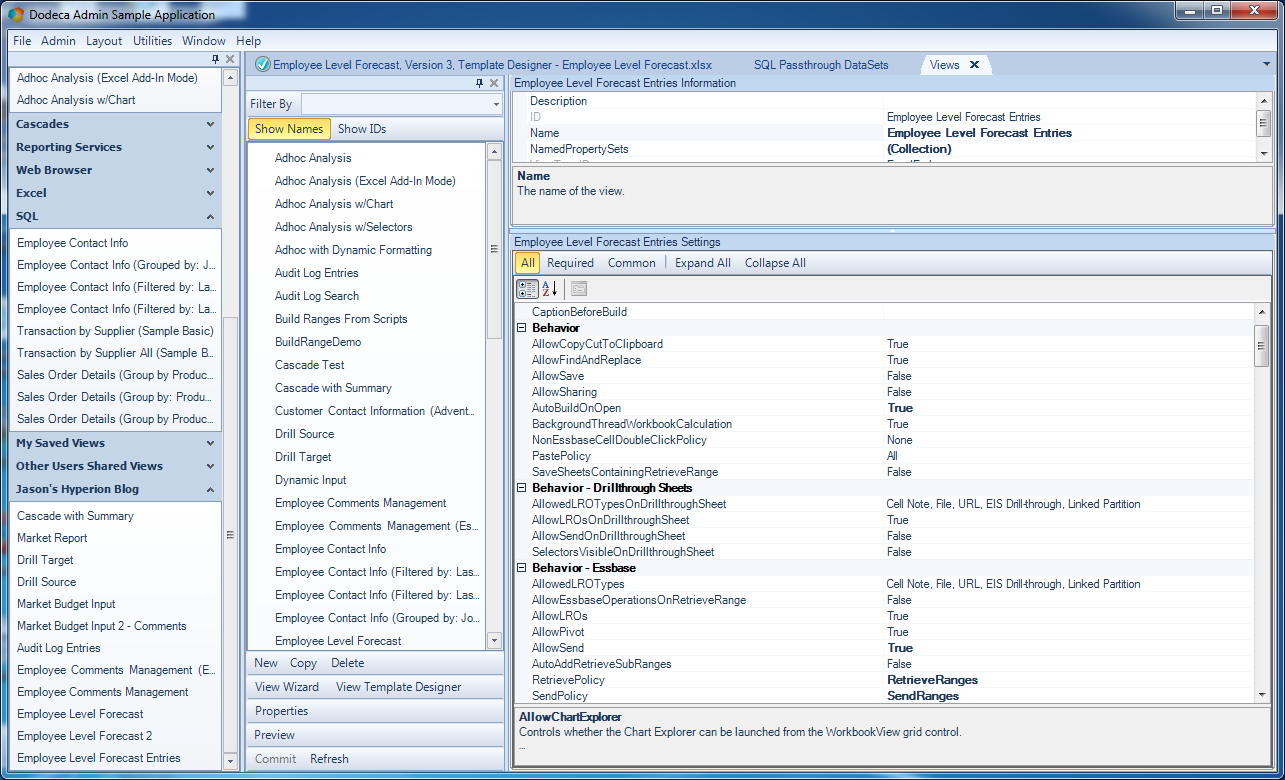
Initial view options for Employee forecast view

Initial view options for Employee forecast view

As with before in this series, options that are in bold are ones that do not have a default value set (this is an incredibly awesome feature by the way). As you can see, I set the AutoBuildOnOpen to True (so that, unsurprisingly enough, the view builds [if it can] when it is opened). I have enabled Essbase data sending (AllowSend = True), and configured the RetrievalPolicy and SendPolicy to RetrieveRanges and SendRanges, respectively. By default Dodeca will consider the entire sheet as the send range, but since we have multiple ranges in play, we want to tell that to Dodeca.

Scrolling down a little bit shows more view options I’ve tweaked:
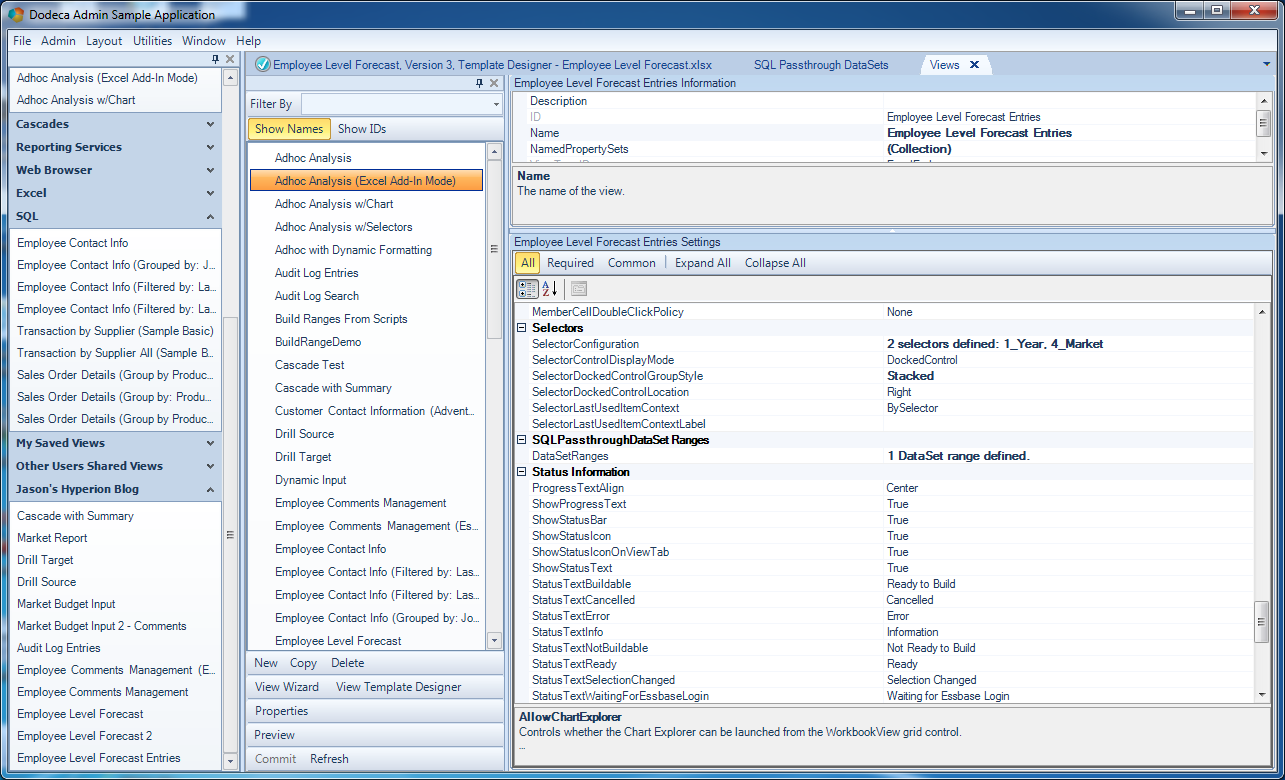
Additional Employee Forecast view options

Additional Employee Forecast view options

There are two selectors defined (for the Year and Market user selections). For the selector grouping I have chosen Stacked (I like this UI model in many cases since it shows more of what’s going on at once). As you’ll see in a moment, this option results in the selectors being shown on the side of the view, one on top of the other. The remaining non-default option on this screenshot is the SQLPassthroughDataSet Ranges group, showing I have a DataSet defined. The DataSet needs to be defined a little bit:
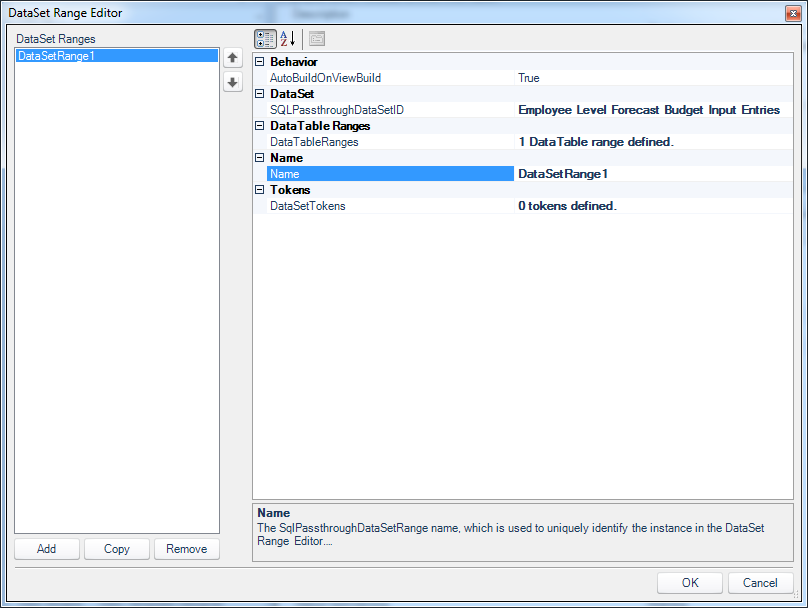
Editing the data table range on the view

Editing the data table range on the view

There’s not a lot here except to note that there’s a single DataTable definition, which we also need to make sure is setup properly:
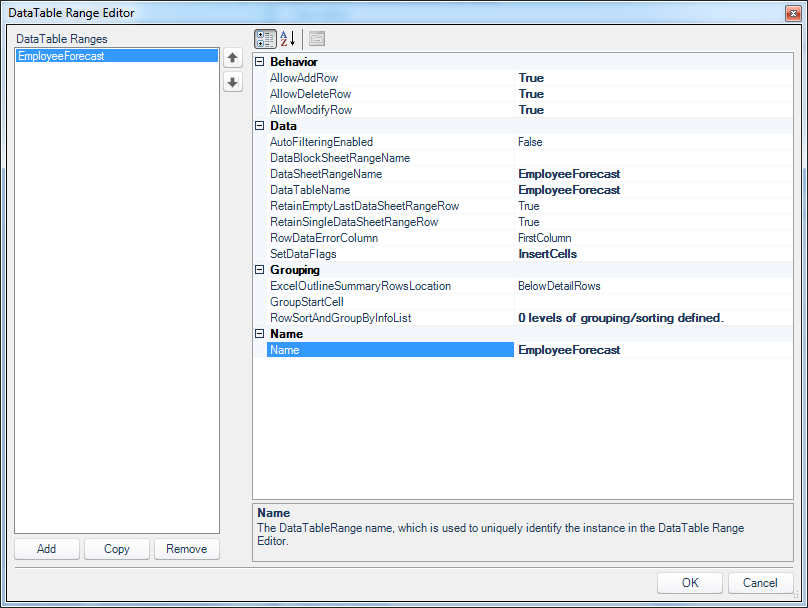
Configuring our DataTable

Configuring our DataTable

In this data table (think of this as a view-specific window into our SQL definition from the passthrough dataset), we explicitly tell Dodeca that yes, adding rows, deleting rows, and modifying rows is allowed (we can choose any/all/none of these to be enabled). Further, we specify the range name on the sheet that corresponds to this data, and lastly I have configured one of the SetDataFlags to include the InsertCells setting. This setting is useful in this case so that cells/rows are logically inserted to the spreadsheet as needed – thus preserving my formatting and cell references, just as if we had been in Excel and inserted a row.

Lastly on the view options are the following:
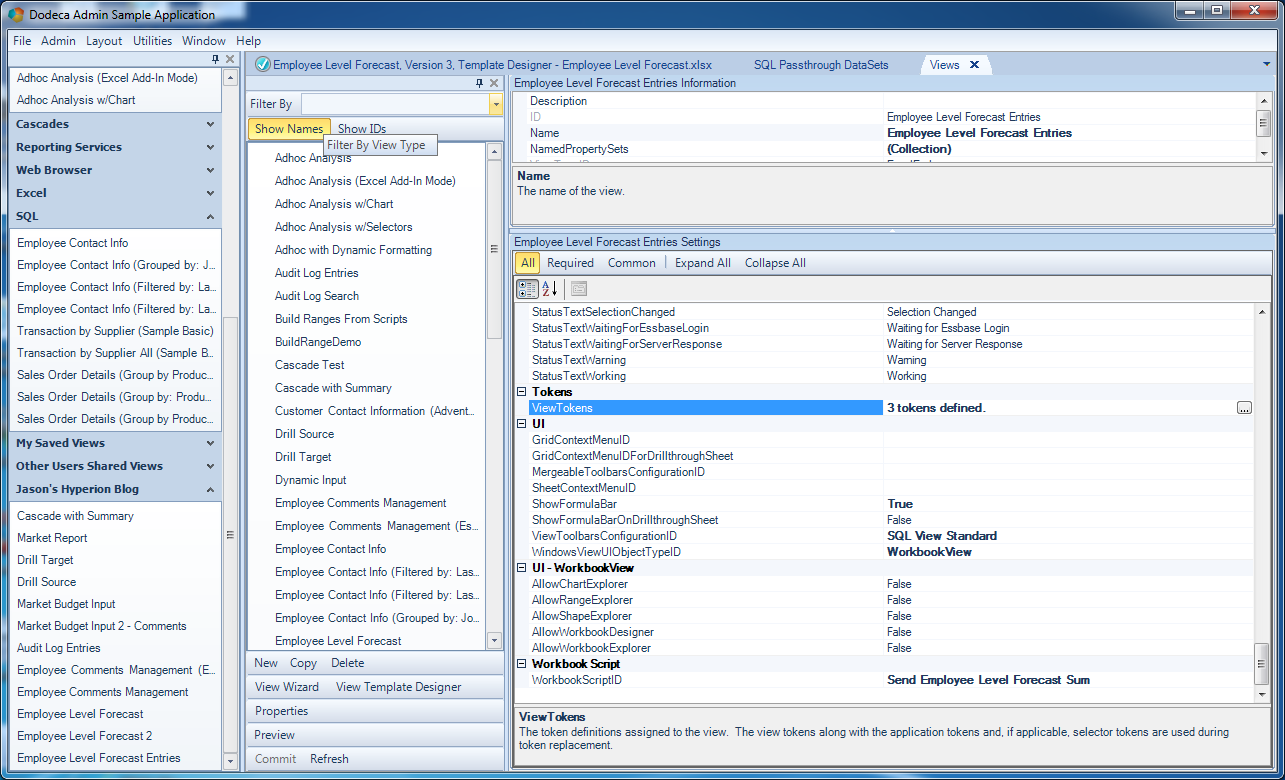
Yet more view options on the view

Yet more view options on the view

Here we see that I have 3 tokens defined on the view itself (only one of these is relevant to our purposes at this moment), and the formula bar is set to display (for now). Notice the ViewToolbarsConfigurationID setting. Here I’ve chosen the “SQL View Standard” item. This is a really interesting setting and it warrants a moment to explore. In Dodeca, the toolbar that that is shown for a particular view is configurable. That is, we can choose which toolbar to be shown (as a really advanced topic to be explored a future date, the toolbars themselves are completely configurable). I think this is a really, really interesting feature in Dodeca. Most tools don’t give you this level of configurability. Generally, the UI is quite fixed, and yet here can basically do what we want (of course, most of the time we’ll just choose a default toolbar such as we are doing here). And we get that flexibility without having to dig around in some custom programming or hack job scripting that will make system upgrades down the road a complete nightmare. To Dodeca, it’s just all some data and metadata (no big deal).

Workbook Scripting

The very last configuration item to note, and one what I’m going to dive into right now, is the Workbook Script setting. We can leave this setting blank (as it often will be), indicating that there is no associated workbook script (they are optional), otherwise, we choose a workbook script to be associated with this view.

I won’t go so far as to say that workbook scripts are the secret sauce, the glue, or the magic in Dodeca views. I mean, they are all of these things, to some extent, but there’s another way to look at them. Think of the spreadsheet view paradigm as being declarative. It’s descriptive: you lay out the grid, you tell configure some options and settings, and let the tool (Dodeca) figure out what to do with it. Then you have workbook scripts. For those times when being declarative isn’t enough, workbook scripts add all of the procedural functionality you need to do things. Workbook scripts provide functionality that executes in accordance with a event-based model. For example, there are many events associated with the view lifecycle: opening the view, the user selecting tokens, the user requesting to build the view, the view being built, the user submitting data, and more. There are many, many events in the view lifecycle and we can ‘hook’ into them simply by selecting it from a list and pointing it to some section of methods in our same workbook script.

So, let’s open up the workbook script that I have already created and take a look at it. Nicely enough, we can simply right click on the WorkbookScriptID cell on the view options screen and select Edit Workbook Script (how convenient!). You can see that the workbook script editor has four main panels:
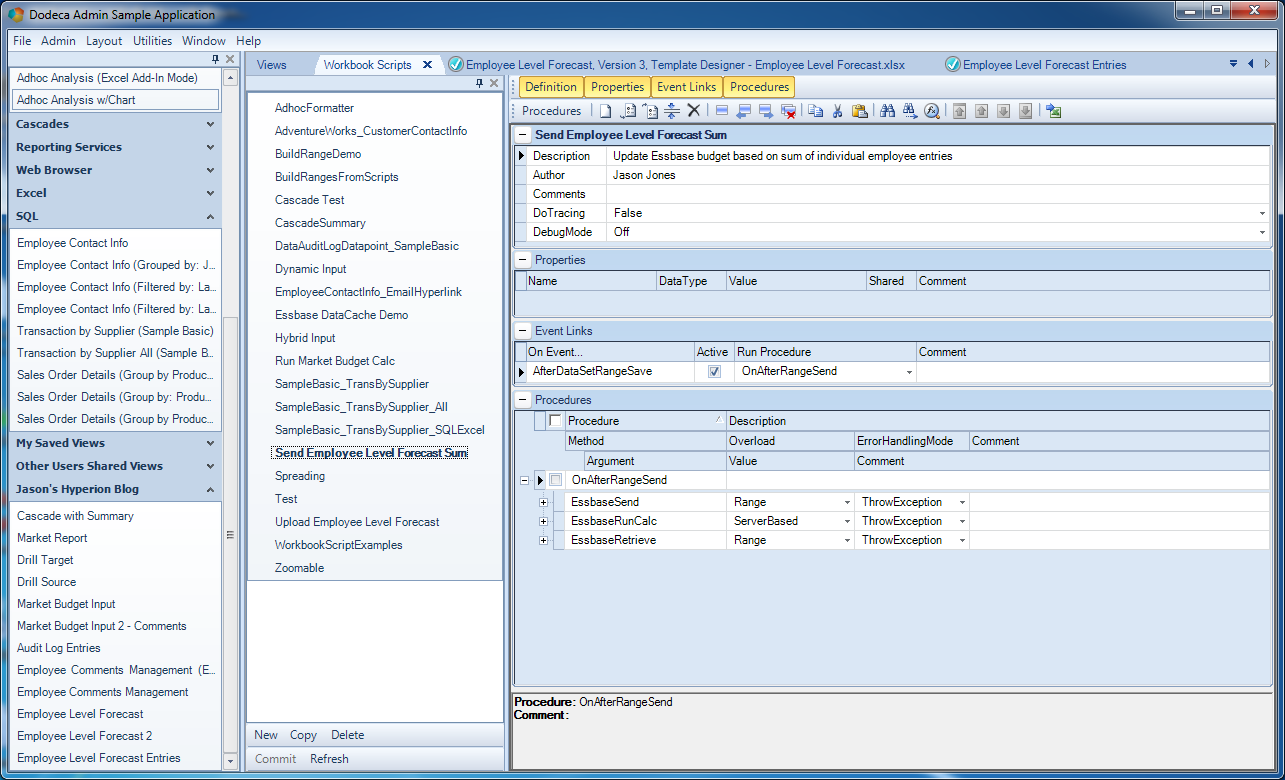
Employee forecast input workbook script

Employee forecast input workbook script

The four panels are basic information about the entire script, a list of optional properties, event links, and procedures. There’s not much to see in the basic properties right now: just a description of the workbook script that I provided, the author name, and some default values. Next, in the Properties panel, you can see that I don’t have any properties defined, so we don’t need to worry about that for now.

Over in the Event Links panel is where things start to get interesting. I just mentioned that there are numerous events in the view lifecycle and that we can attach a procedure such that it executes at the proper part of the lifecycle. There are times that we need to hook in to things at different steps so that we can modify data on the grid, add a property, or otherwise perform some action that will affect the rest of the actions that occur between the user selecting values and the user seeing what they want to see.

Recall the original stated goal of this view: we want to input relational data and when the user submits the data to be saved in the relational database, we’d like to take that data, sum it up, send it to the cube, then refresh the view of data from the cube for that intersection. So one of the events we can hook into is the AfterDataSetRangeSave event, meaning that after the relational dataset is saved, we want Dodeca to fire off our custom procedure.

As for that procedure itself, that brings us to the fourth panel in this editor. Look at how the name of the procedure to run (OnAfterRangeSend) corresponds to the name of the procedure below. Below this procedure name and indented are three rows. These are the individual methods of the procedure. They’ll run in succession when the procedure is executed. Let’s take a look at the details of these three steps:
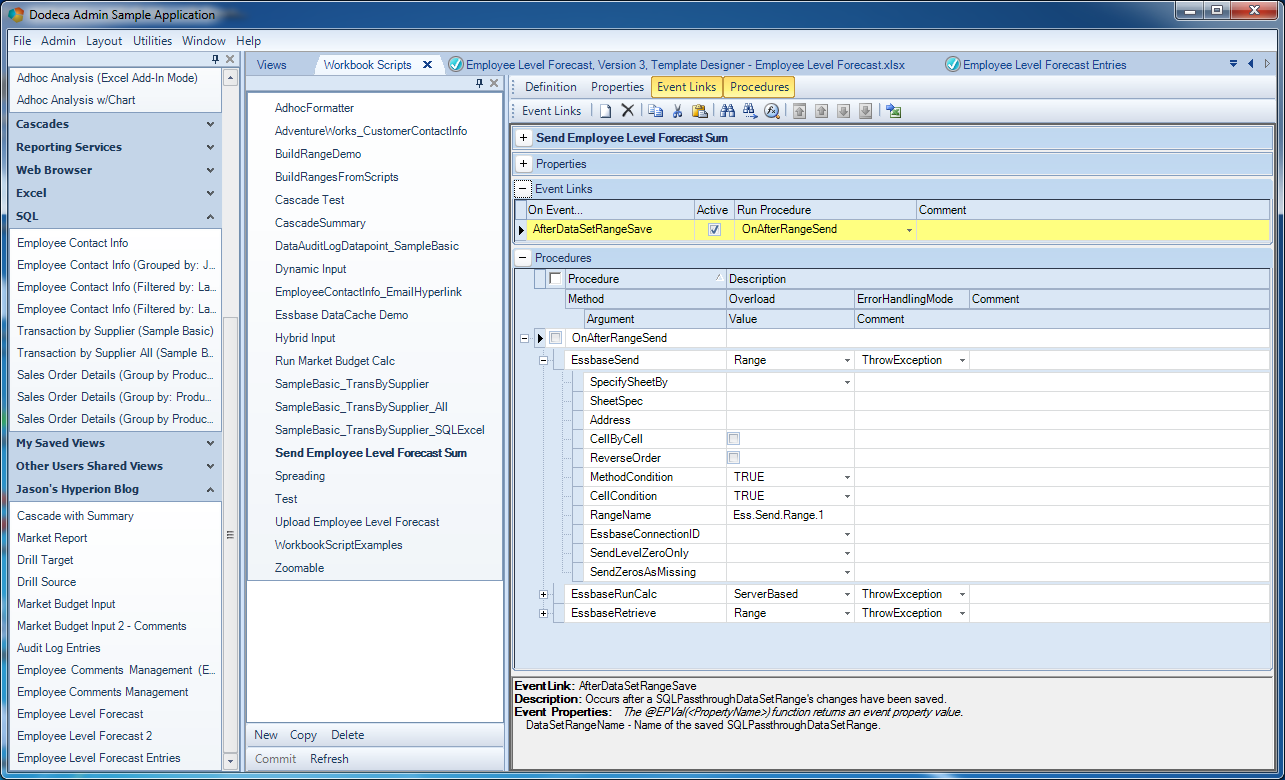
Workbook script, step 1

Workbook script, step 1

The first step is that we want to send a range of data up to an Essbase cube. All of the rows for this step are shown. Most of them are default values, though, so while it may look like a lot of configuration, it’s really not. In fact, the only thing at all that had to be changed on this method was to fill in the RangeName parameter with a value of Ess.Send.Range.1. The rest of the options are defaults. Now, think back to this corresponding send range that we configured in the template (the hidden one). Even though it’s totally visibly hidden from the user, it still exists, still has data, and can still be used to upload to Essbase. Further, the POV for this range references tokens from the user selectors, and the singular data cell on the range (the cell to be written back to Essbase), is simply a cell reference that points to the cell containing the sum of the data in the SQL data table. So there’s nothing we have to do to this range to prep it before sending it up to the server.

In other words, think of this as a completed automated sequence that is equivalent to us using the Excel add-in to punch a data value into a grid, select the grid, connect to Essbase, then lock it and send it (or perform a Submit Data).

While we’re on this procedure, look at the EssbaseConnectionID setting below the RangeName setting. It’s blank. Again, wherever possible, Dodeca tries to provide sensible defaults or Do The Right Thing. In this case, with no provided Essbase connection, it simply uses the Essbase connection already present on the grid. So we don’t need to specify it. But interestingly enough, we could. And more interesting – it doesn’t even have to be the same Essbase connection that the sheet uses. That’s right, if we were so inclined, we could just retrieve data on the sheet from one (or more) cube, then send the entered data back to a completely separate cube.

The next step in this sequence, to be run after we’ve uploaded the proper data to the cube, is to run a calc to roll it up:
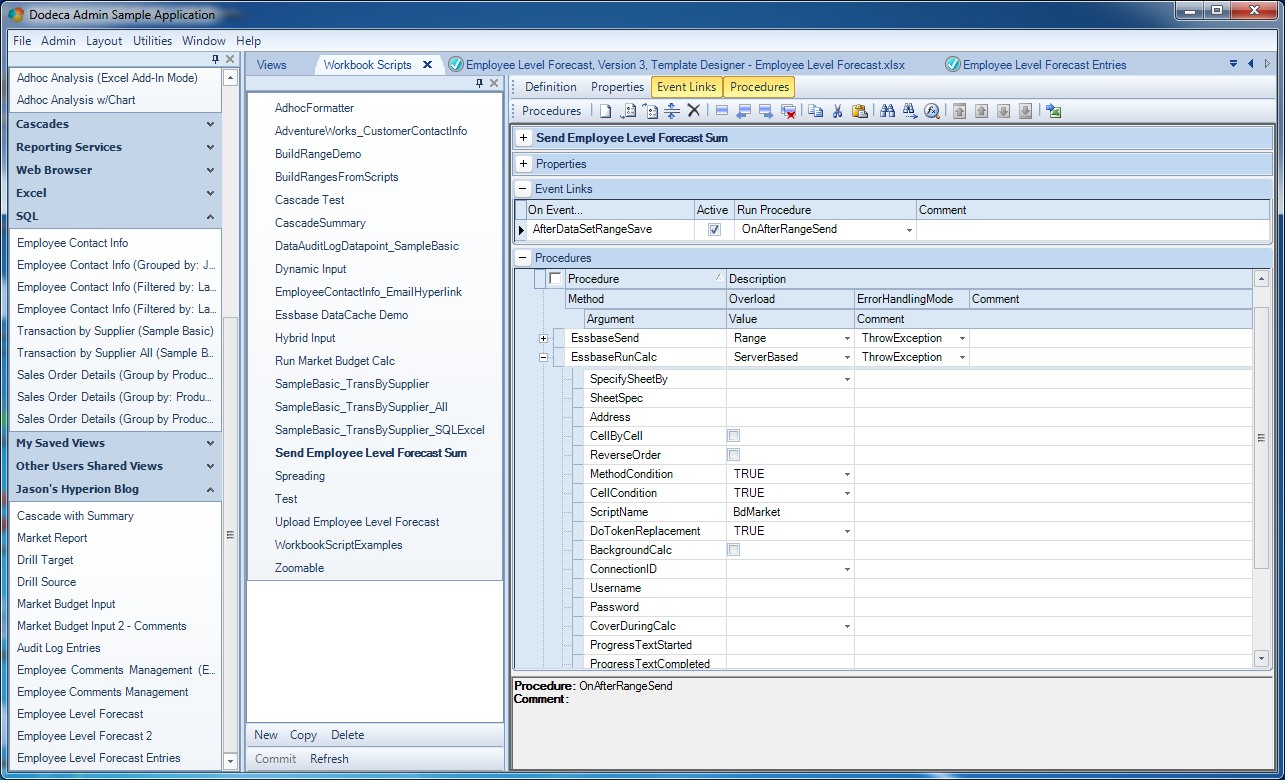
Second method in our Employee forecast workbook script

Second method in our Employee forecast workbook script

This is accomplished with the EssbaseRunCalc method type. Further, this is the ServerBased version of the method (meaning to run a calc located on the server/cube). Again, defaults are mostly fine here, but I have set two things: the ScriptName and the DoTokenReplacement set to TRUE. Needing the script name should be obvious. Not so obvious is the token replacement. Inside of the script are normal Dodeca tokens, as shown here:
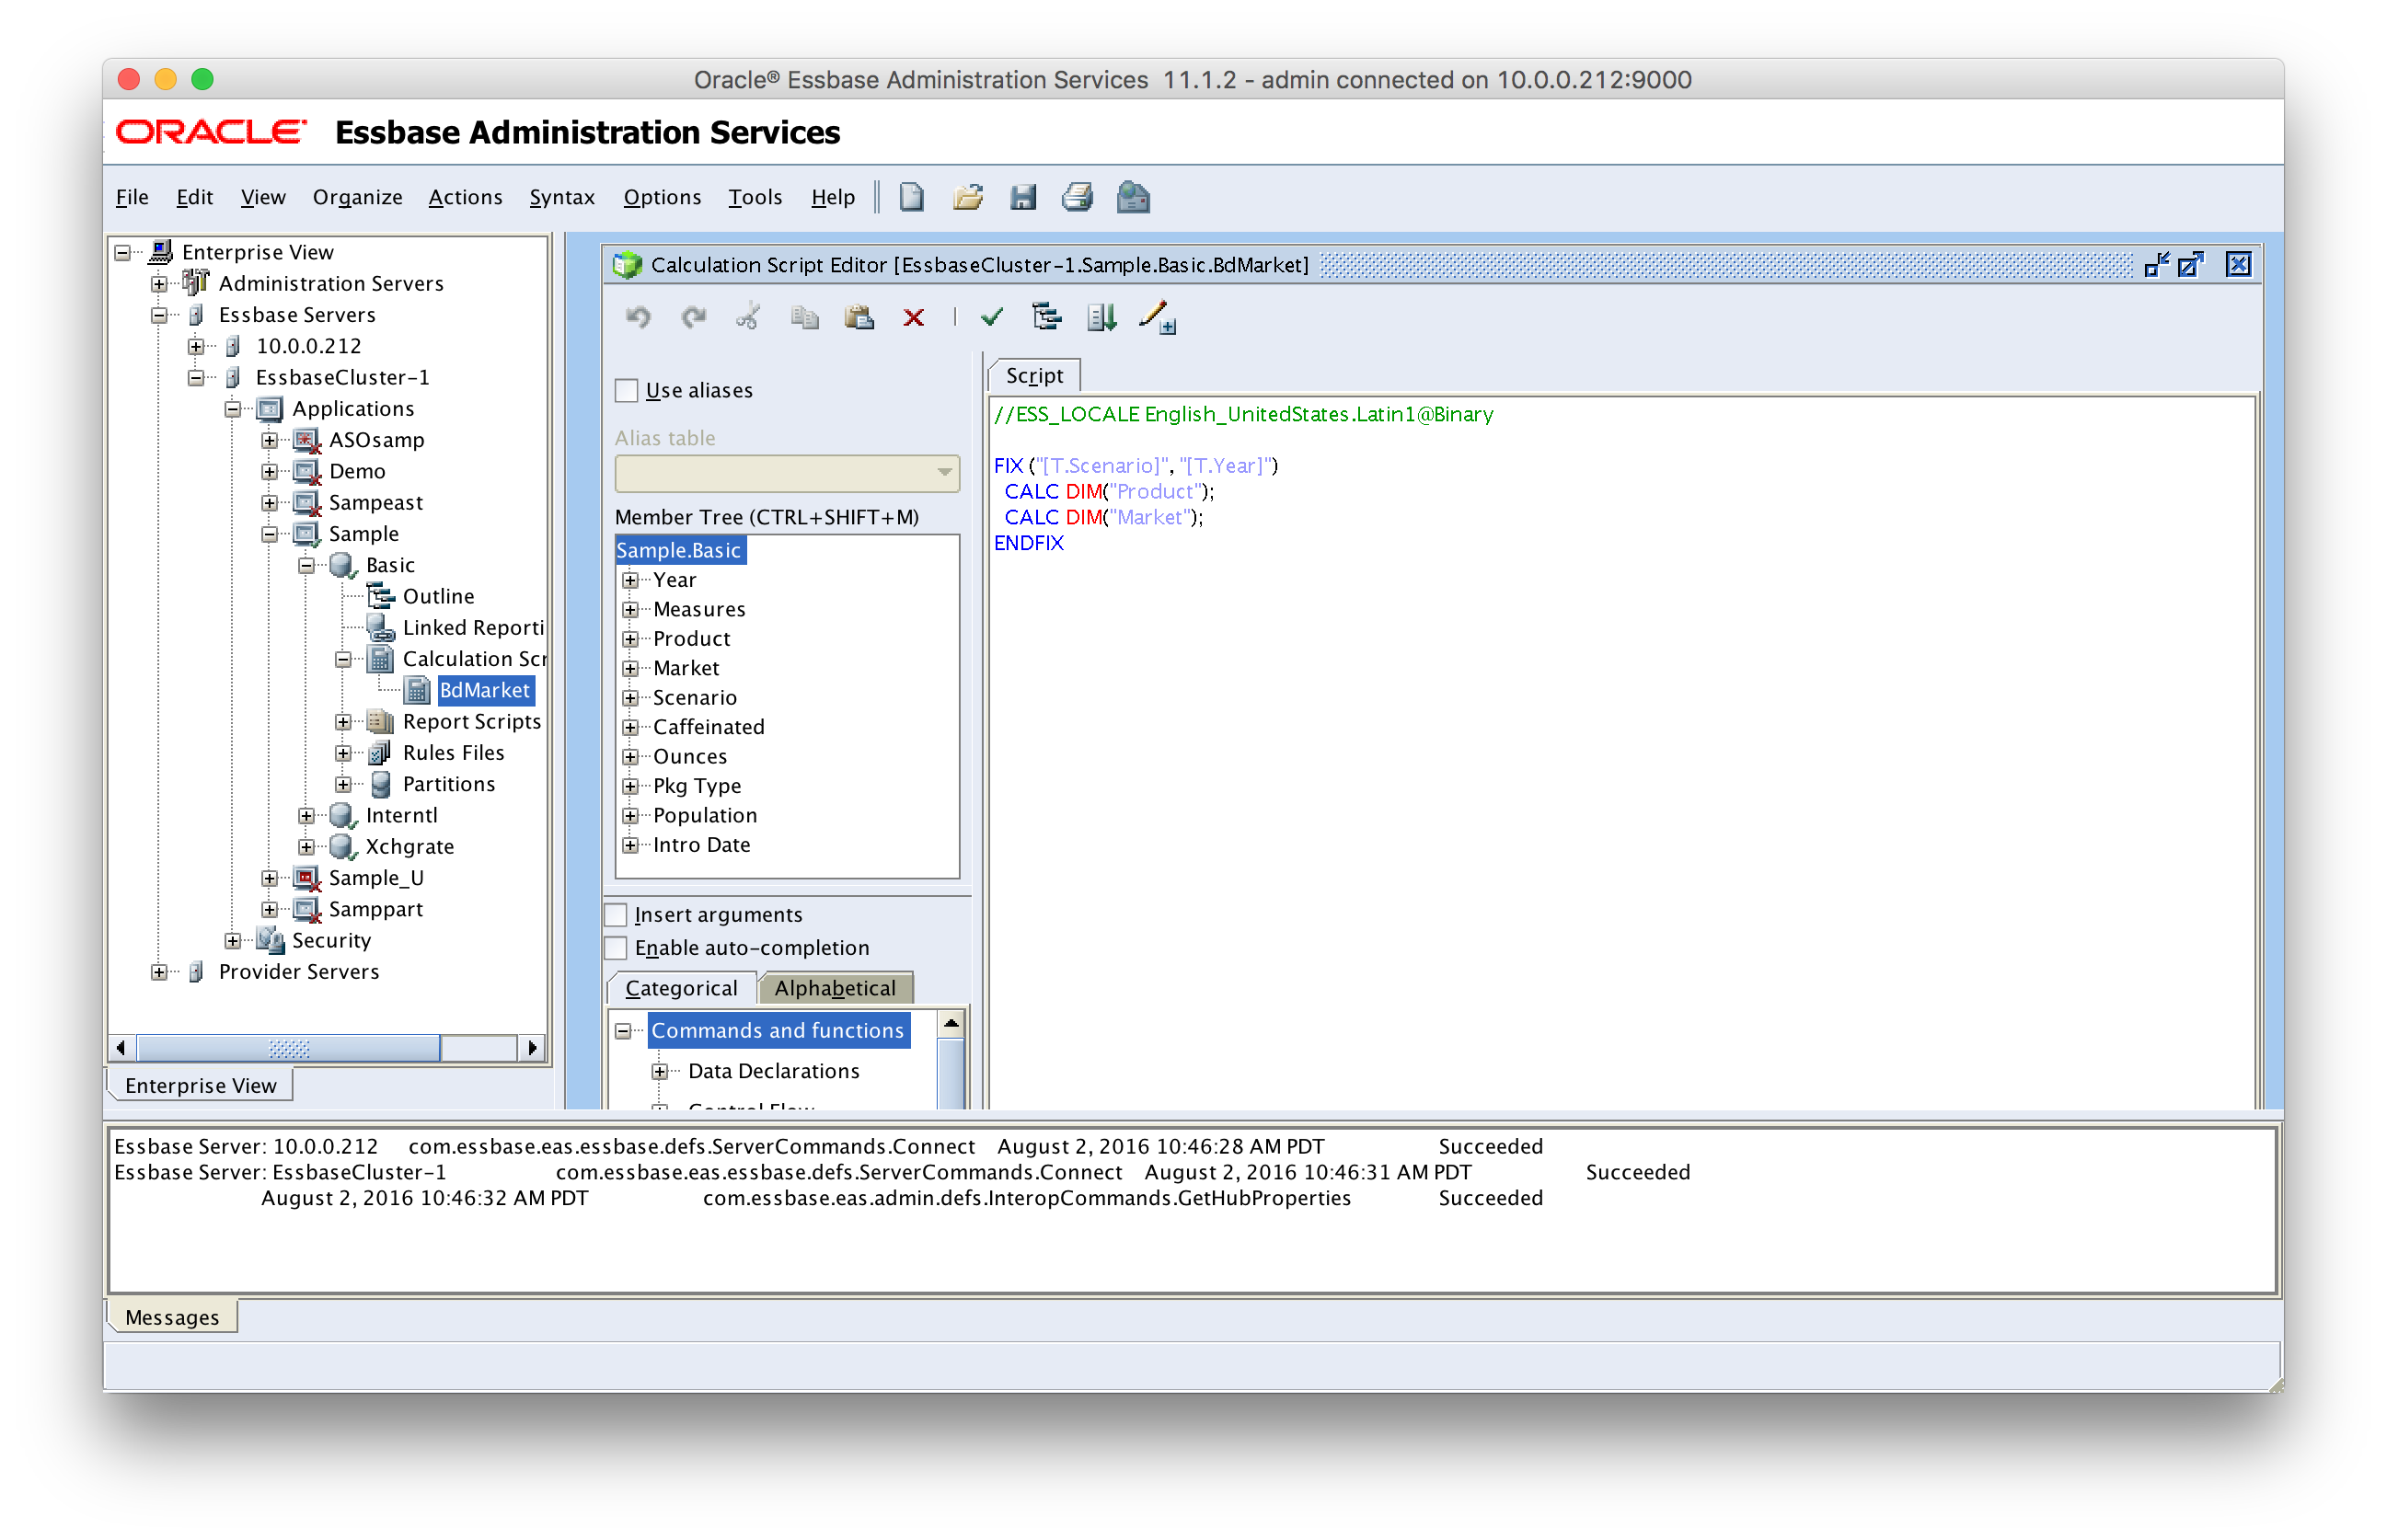
Tokenized calc script

Tokenized calc script

You can see that I used the [T.Scenario] view token and the [T.Year] selector token in the FIX statement. This lets me narrow the range of the calc. As it relates to Sample/Basic, the script will be fixing on the Budget scenario only, and then on the proper time period. I don’t need to worry about aggregating these because Budget doesn’t roll up to anything, and all of the ancestors of the period (e.g. Qtr1 and Year) are dynamic calcs. The parents of the measure I am loading to (Sales) are also dynamic calc. This means I just need to roll up Product and Market, which you can see inside of the FIX.

The last step in the workbook script sequence is to refresh the newly calculated data into the retrieval range. This is handled easily enough with an EssbaseRetrieve method:
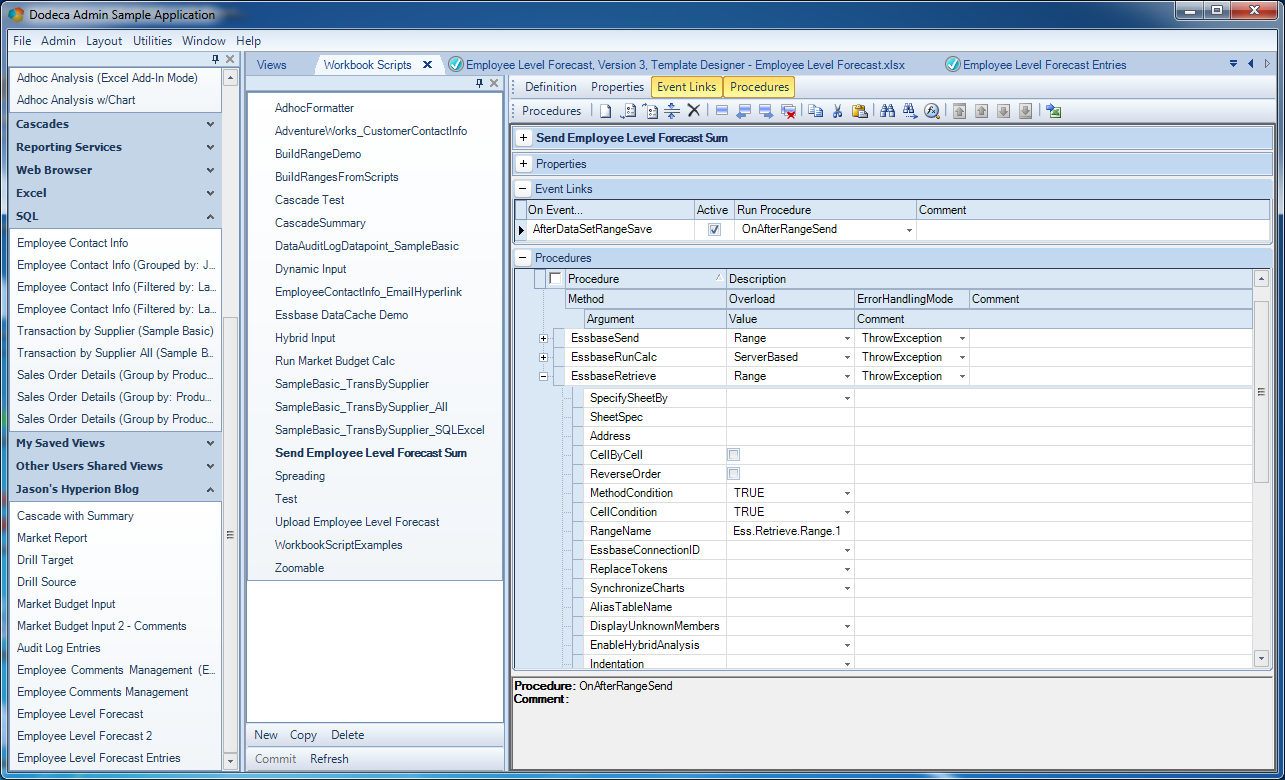
Third step in employee input forecast workbook script

Third step in employee input forecast workbook script

As with before, I am mostly happy with the defaults, and simply filling in the RangeName value to point to my retrieval range of Ess.Retrieve.Range.1 (using the standard Dodeca nomenclature).

From a functional perspective, the view is pretty much good to go. For completeness, I want to cruise over to my SQL tool of choice and take a quick look at the definition of the table that is used to store the forecast/budget entries for the data range:
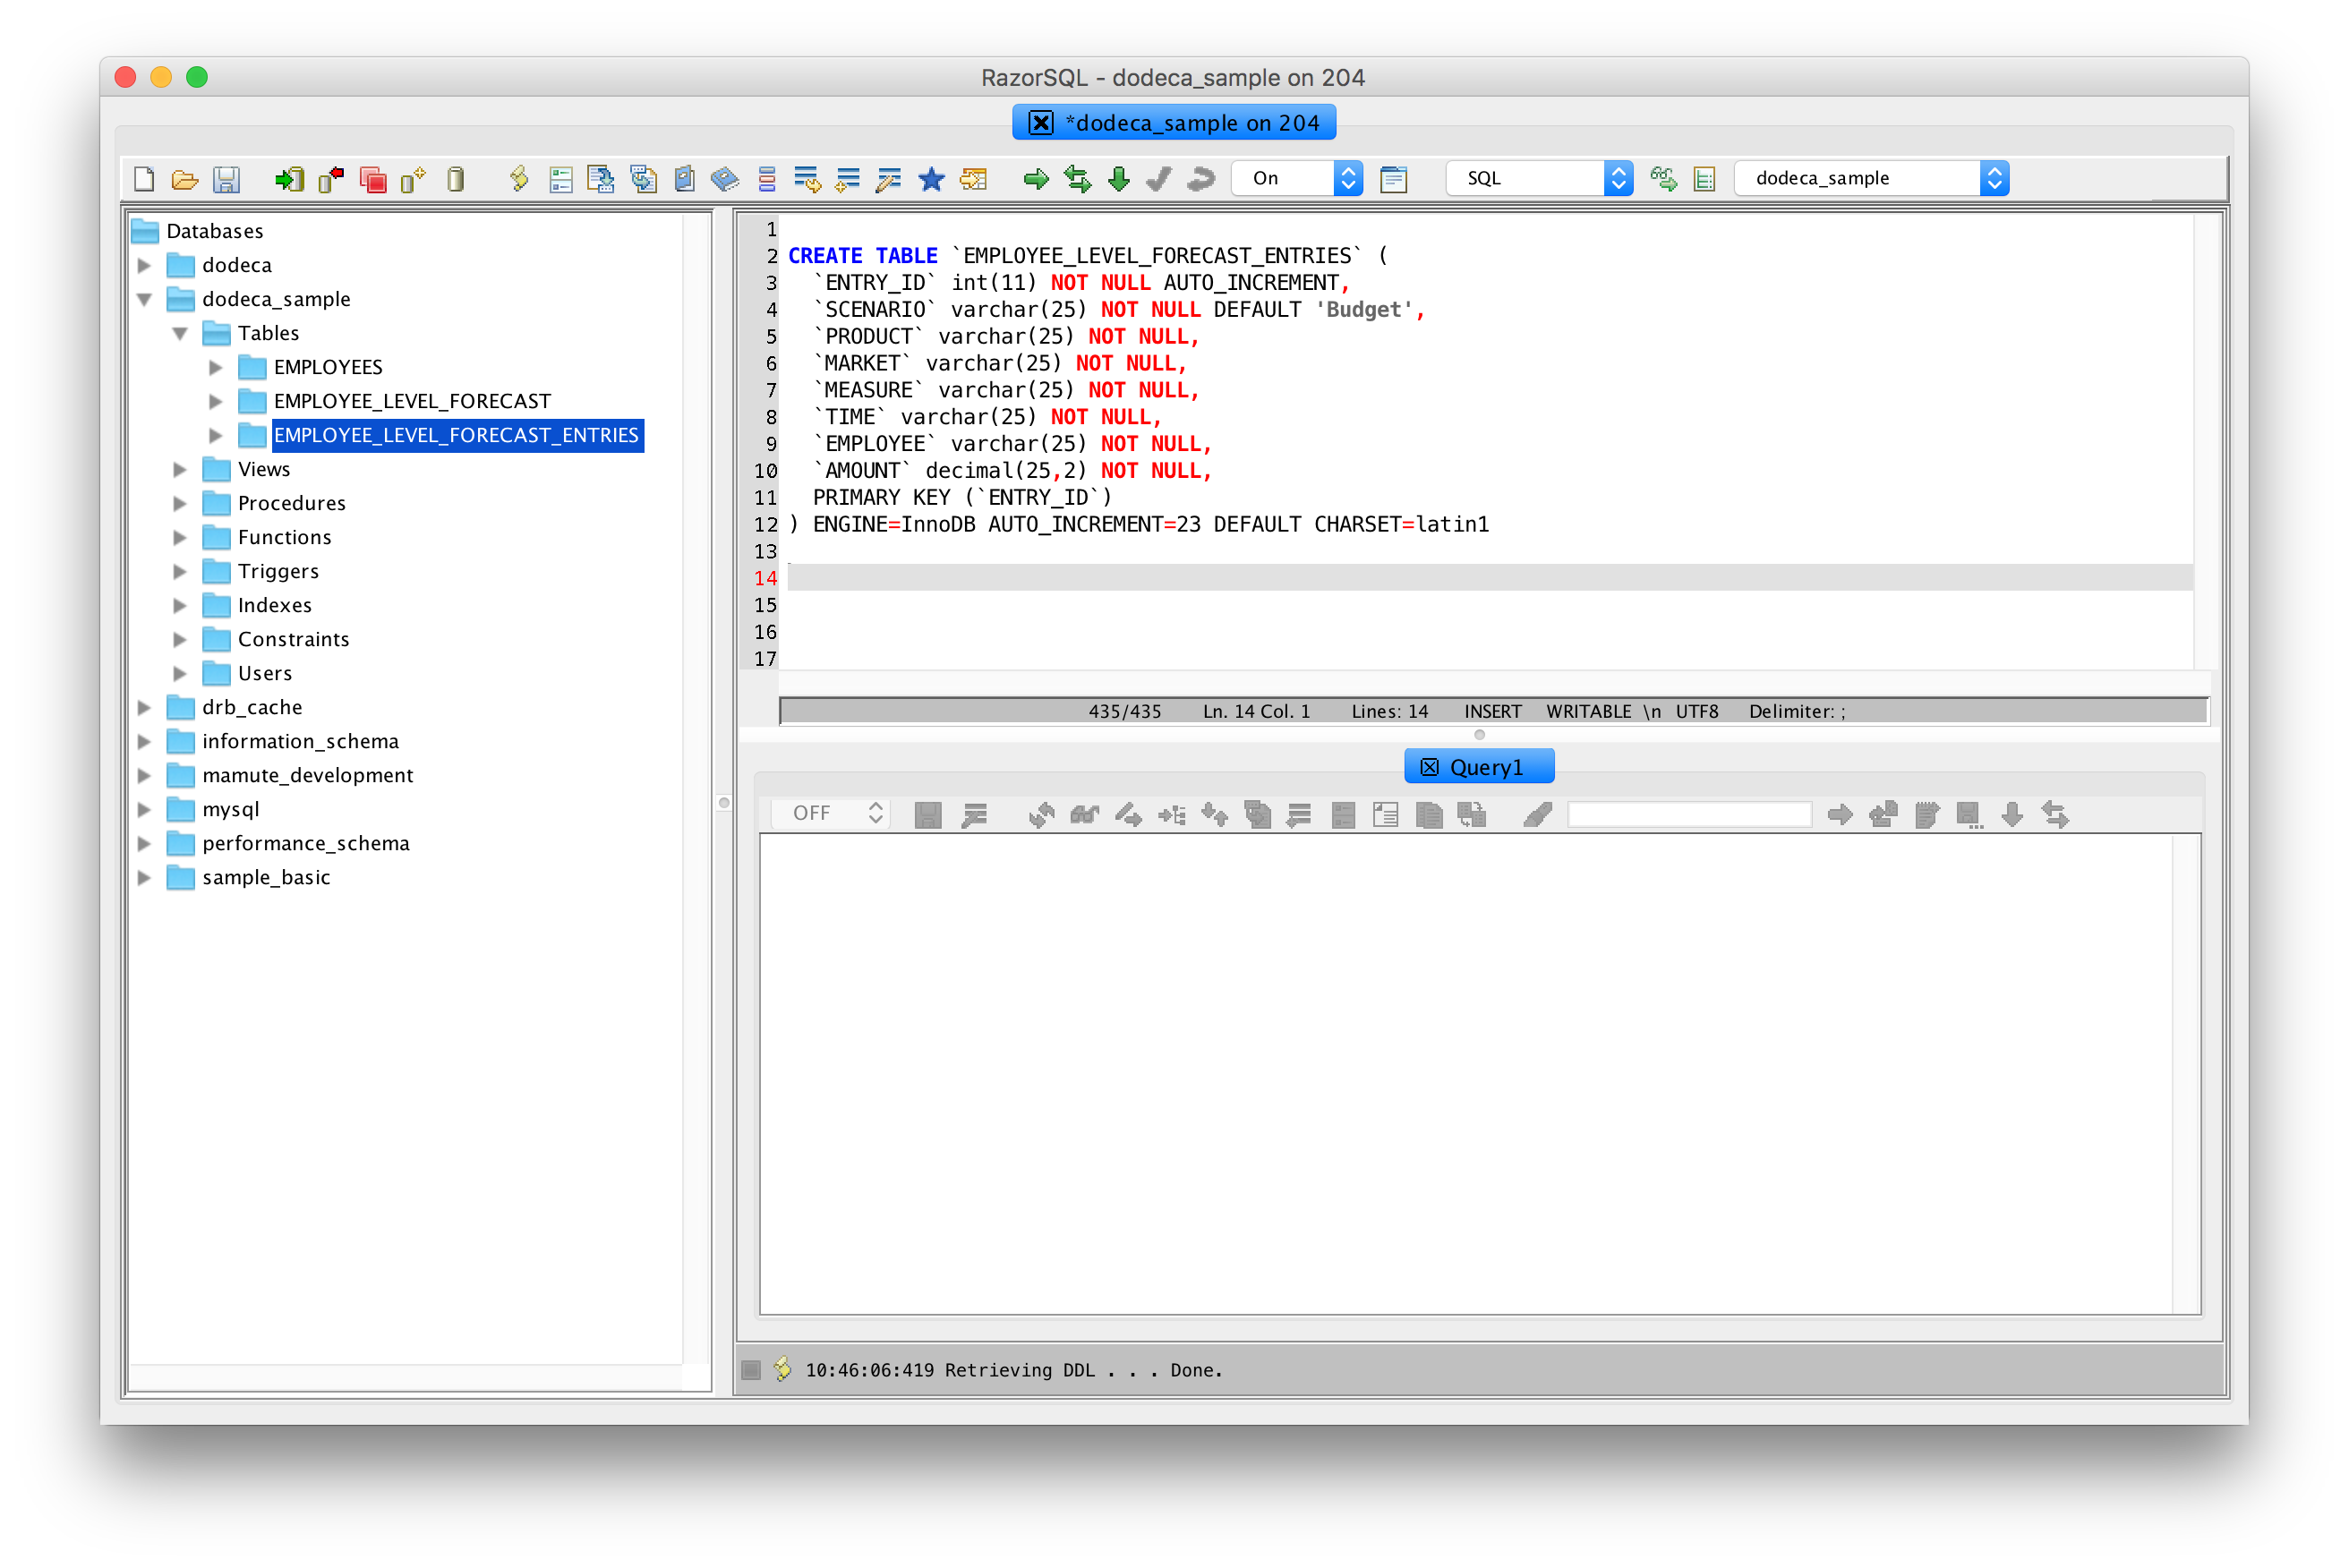
SQL table definition for employee forecast entries

SQL table definition for employee forecast entries

And here is some of the sample data in this table:
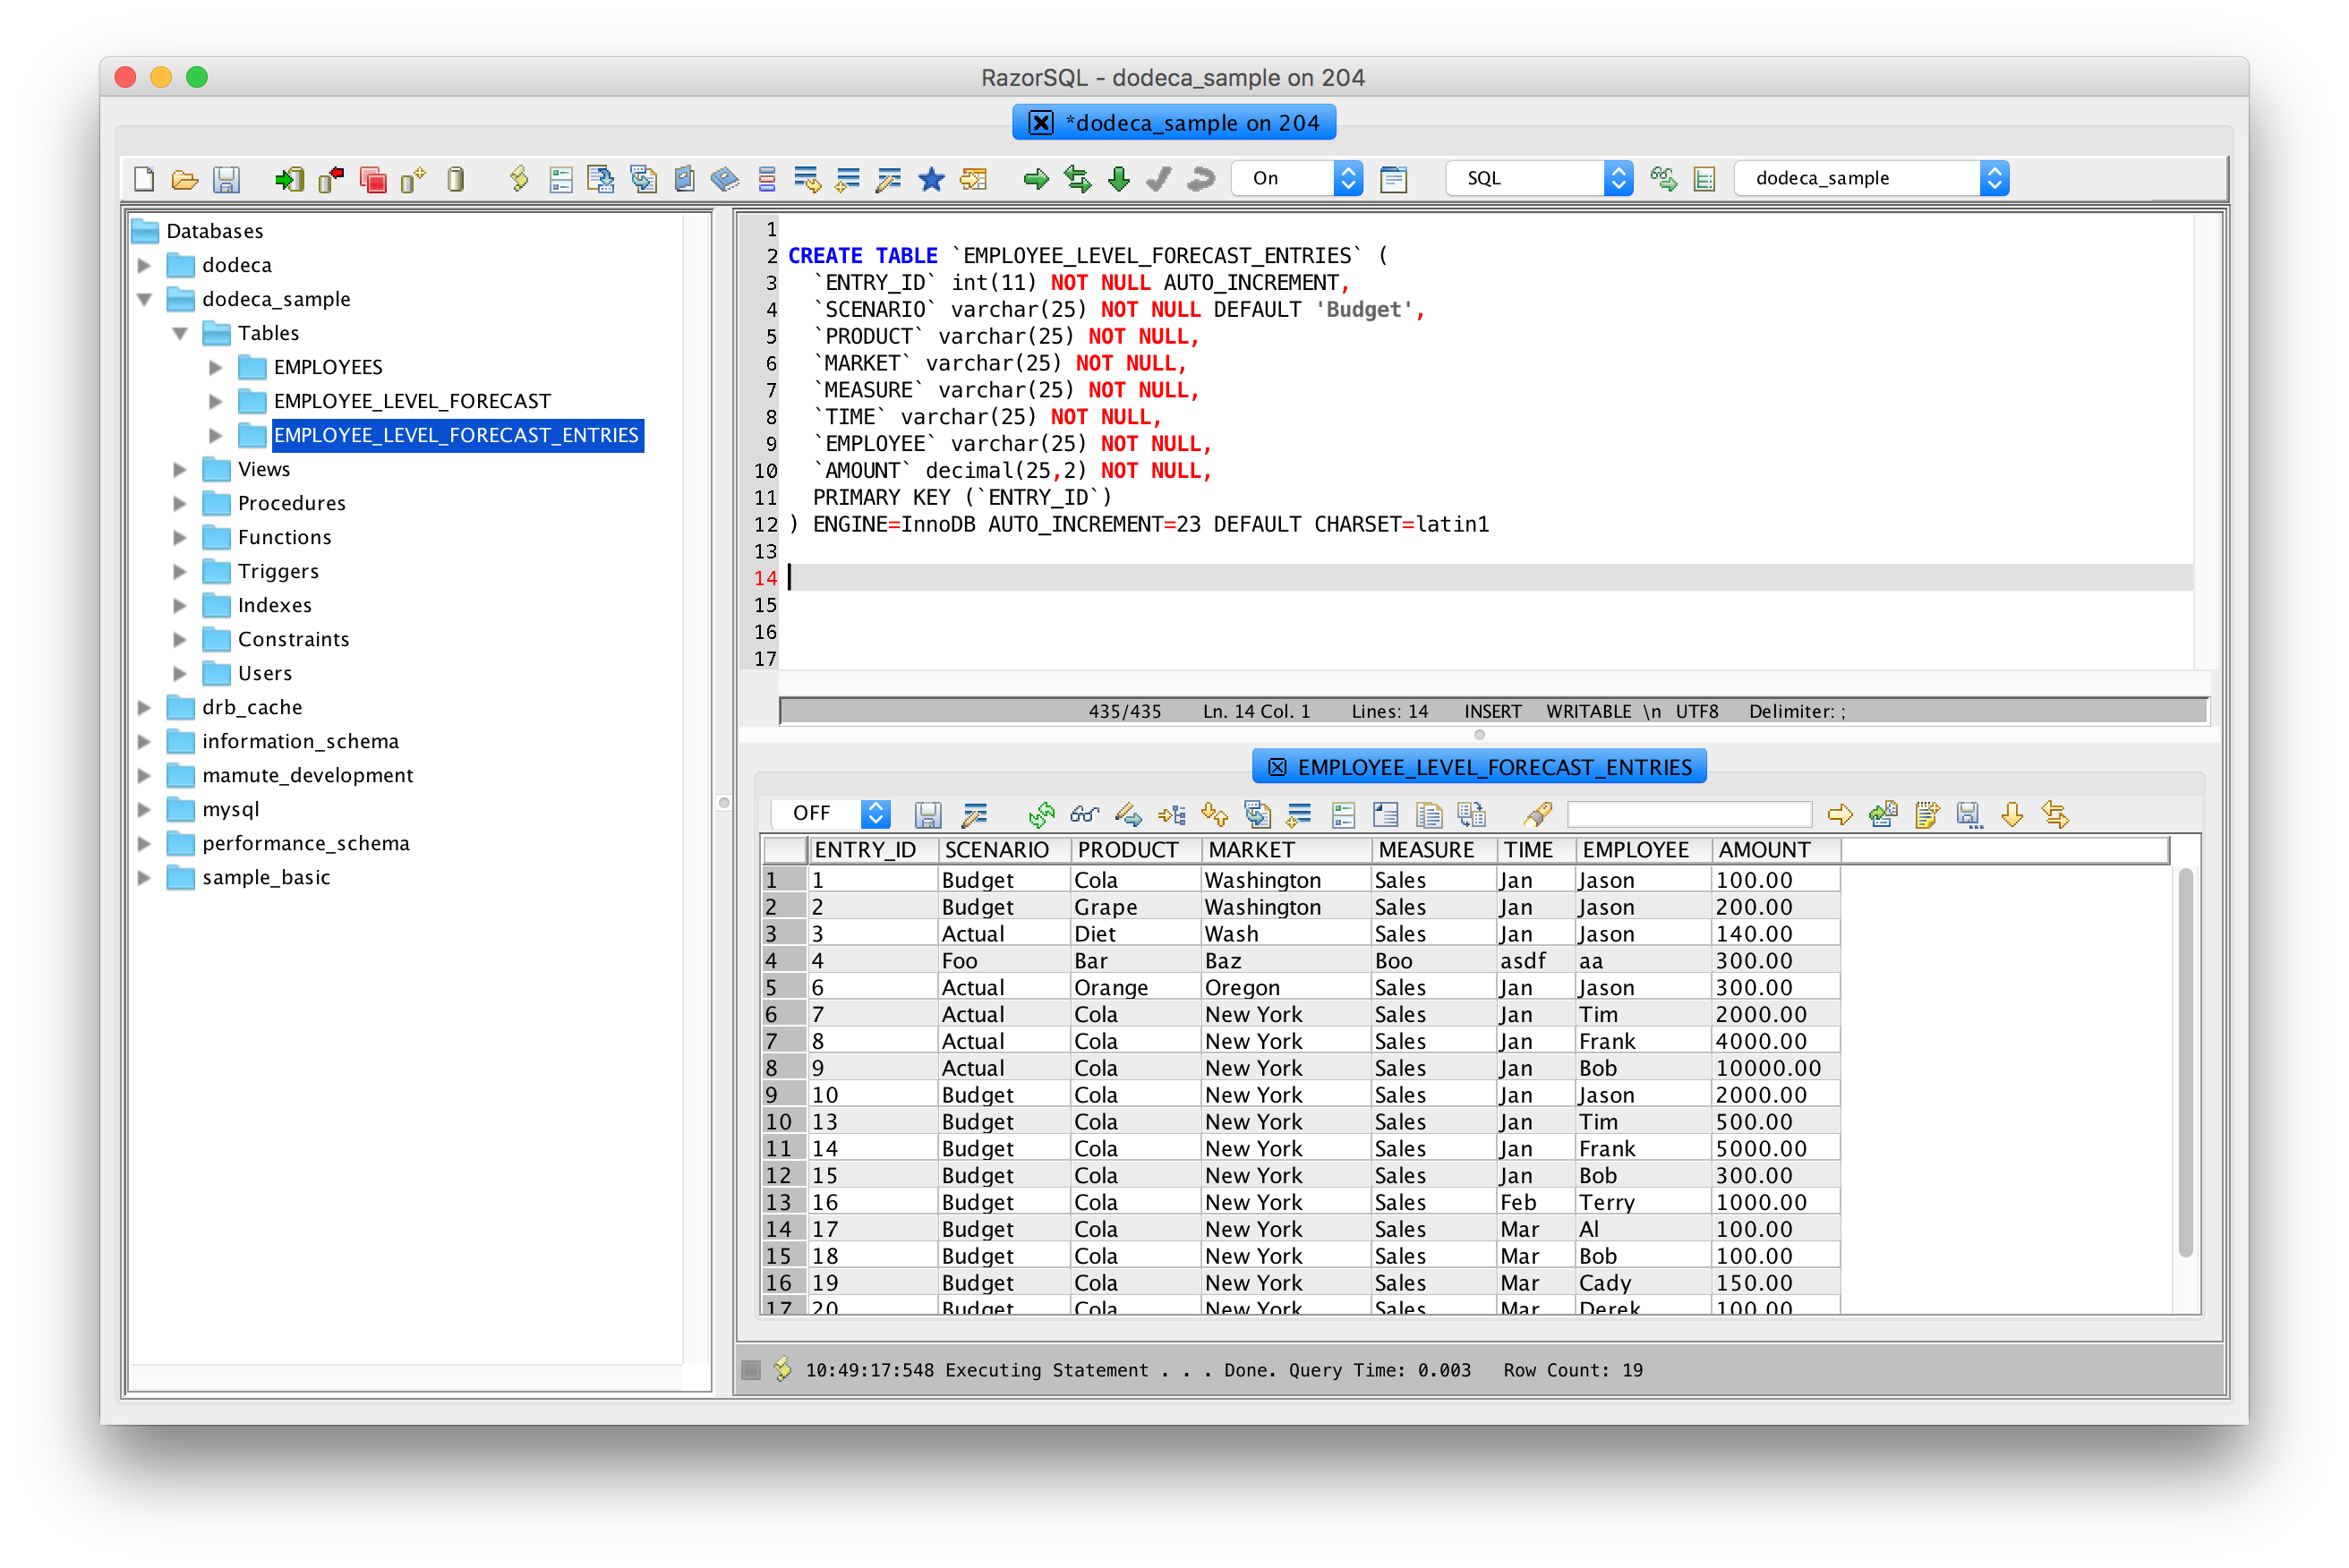
Employee forecast sample data

Employee forecast sample data

We still have some cleanup to do with respect to the view formatting, but let’s go build the view to see how things are looking:
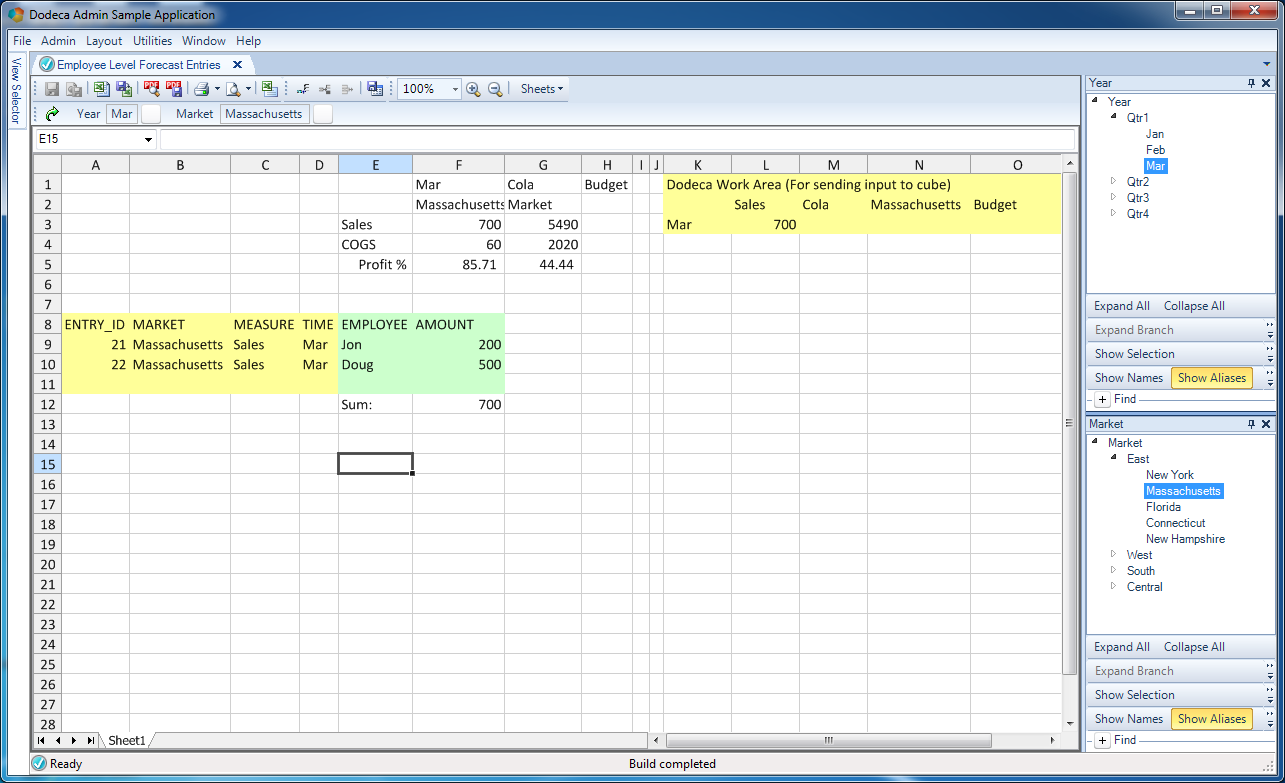
The configured hybrid input view, built

The configured hybrid input view, built

I want to point out something interesting that I configured as well. In this input situation, it doesn’t make sense (in fact, it’s be bad) for the user to budget to an upper level time member, such as Qtr1. I actually configured the selector so that the maximum level for an entry is 0 (a leaf node, or a node with no children, which in this case is the specific months of the year). Look what happens now when I try and select Qtr1:
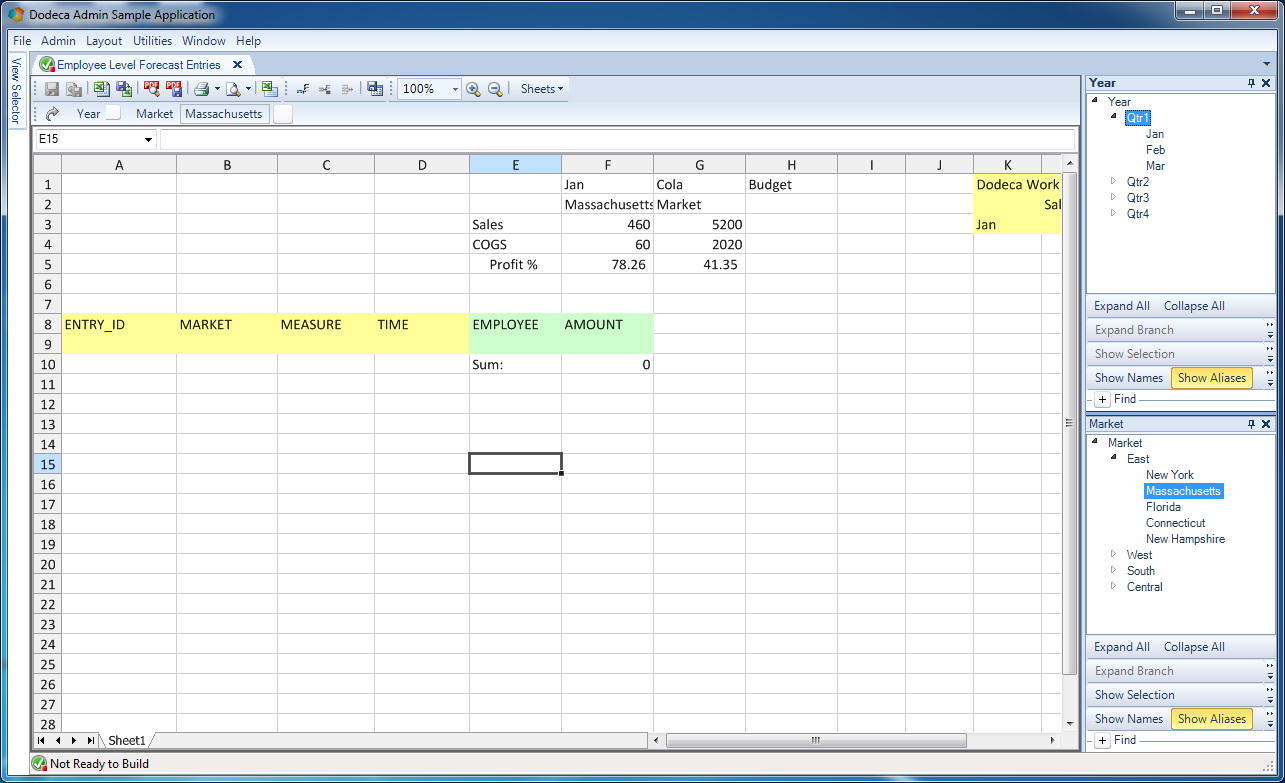
Selector max level in effect

Selector max level in effect

I can select Qtr1, but as soon as I do so, the build option is disabled (what is normally a green arrow icon just above the grid is now a greyed out, disabled icon). This was accomplished over in the selector configuration. Actually, I wound up making a selector for just this purpose, in case I want to reuse it across some other views:
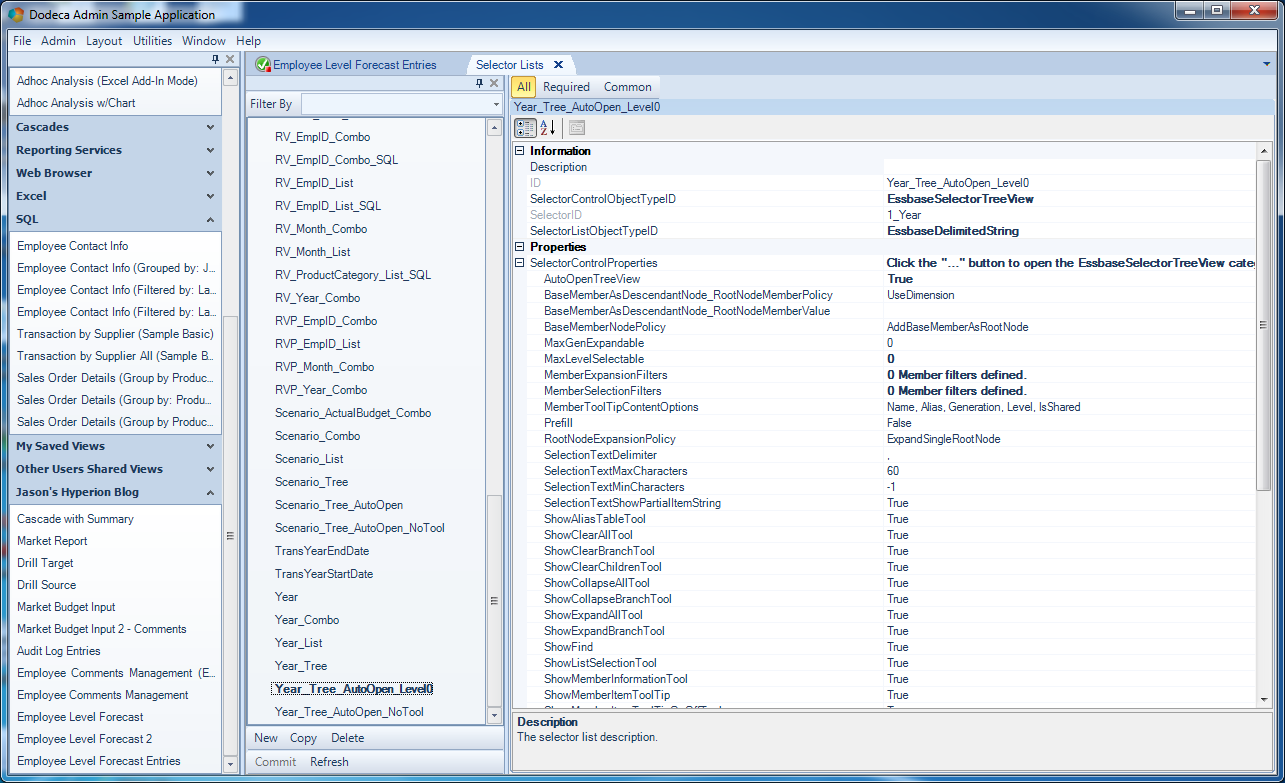
Selector max level configuration

Selector max level configuration

In particular, notice the MaxLevelSelectable value set to 0. If you think about it, the process of selecting a member or members has quite a few nuances to it. We might need a high degree of control as to what the user sees, what they can select, and more. We have the power to be very particular about how selections are made.

The Big Picture

With the SQL dataset, view, workbook script, and selectors are configured, I want to zoom out for a moment and paint a picture/flow of what we’re doing in this view. Consider the following diagram:
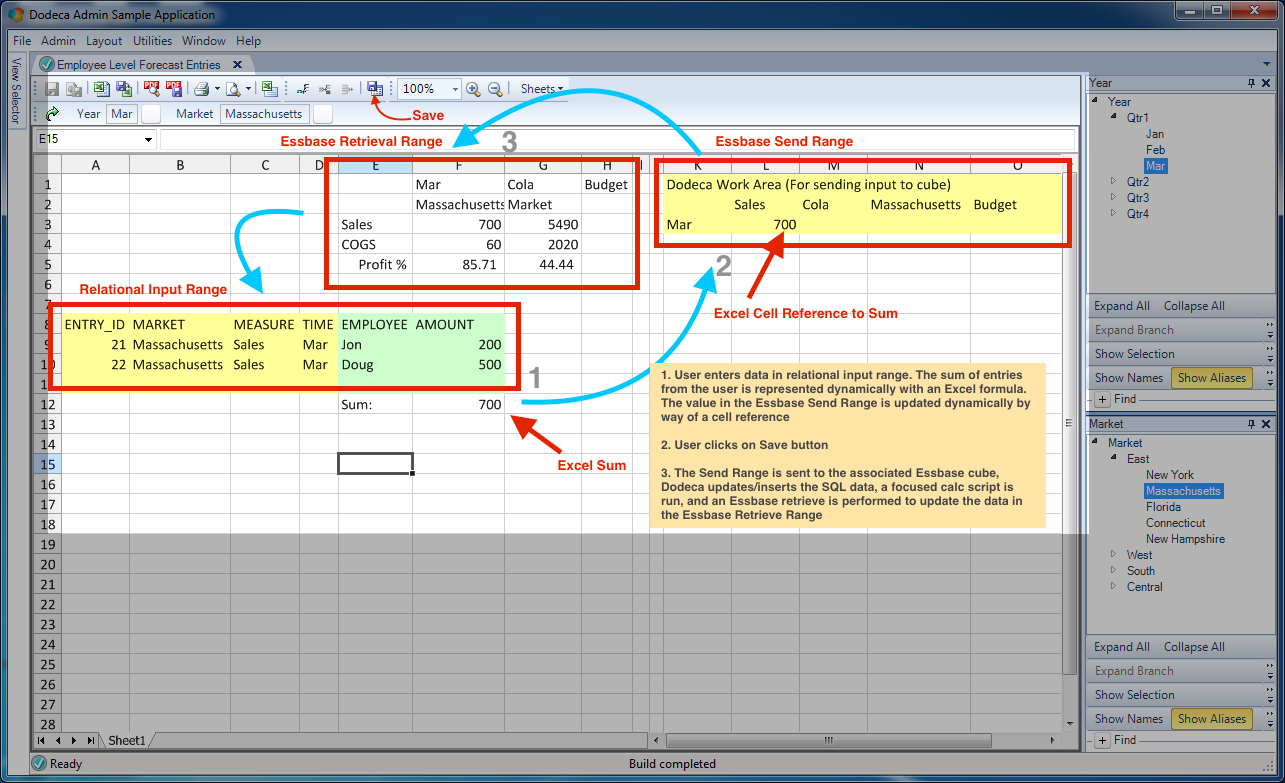
A graphical overview of the dataflow/mechanics of the view

A graphical overview of the dataflow/mechanics of the view

Step 1 is that we (the user) will be adding/editing/deleting rows in the range of data that has been designated as such.  Upon entering the data we are satisfied with, we can save it, using the Save icon on the toolbar (not the disk icon, mind you, but the SQL data save button). Upon doing so, Dodeca sends the data up to the relational database. Next, the sum of the entries we have edited or otherwise already exist will have been dynamically updated into a send range (i.e., the value in cell F12 automatically shows up in cell L3 because it’s a simple Excel formula of =F12). Upon saving the data to the relational data (according to the definition of the SQL Passthrough DataSet), Dodeca kicks off the corresponding workbook script procedure that we setup and associated with the view. The workbook script procedure runs three steps: one to send a range of data up (shown in the above diagram but will be hidden to when we clean up the formatting a bit), the second step to run a tokenized calc script that resides in the cube and aggregates up the higher-level data, then the third step that runs after the calc finishes, and that is to update our Essbase retrieve range. In the Essbase retrieve range, we expect that the value for the current market we’re editing should match up with the sum of values from the relational table.

You might also notice that the retrieve range contains COGS in addition to Sales, as well as a Profit %. Our expectation is that when we edit sales (such as to increase them), that our Profit % (by virtual of being a dynamic calc in the Essbase cube) will go up as well – more so for the specific region, and less so for the sum of all of the regions.

I might call this a “bread and butter” Dodeca template as it employs a fairly common pattern in the Dodeca world: take some data, do some “magic” off to the side, then show the results.

Cleaning Up

With all of the major plumbing looking good to go, we can now turn our attention to “prettying” things up a bit. For starters, we can hide the columns with the Essbase send range:
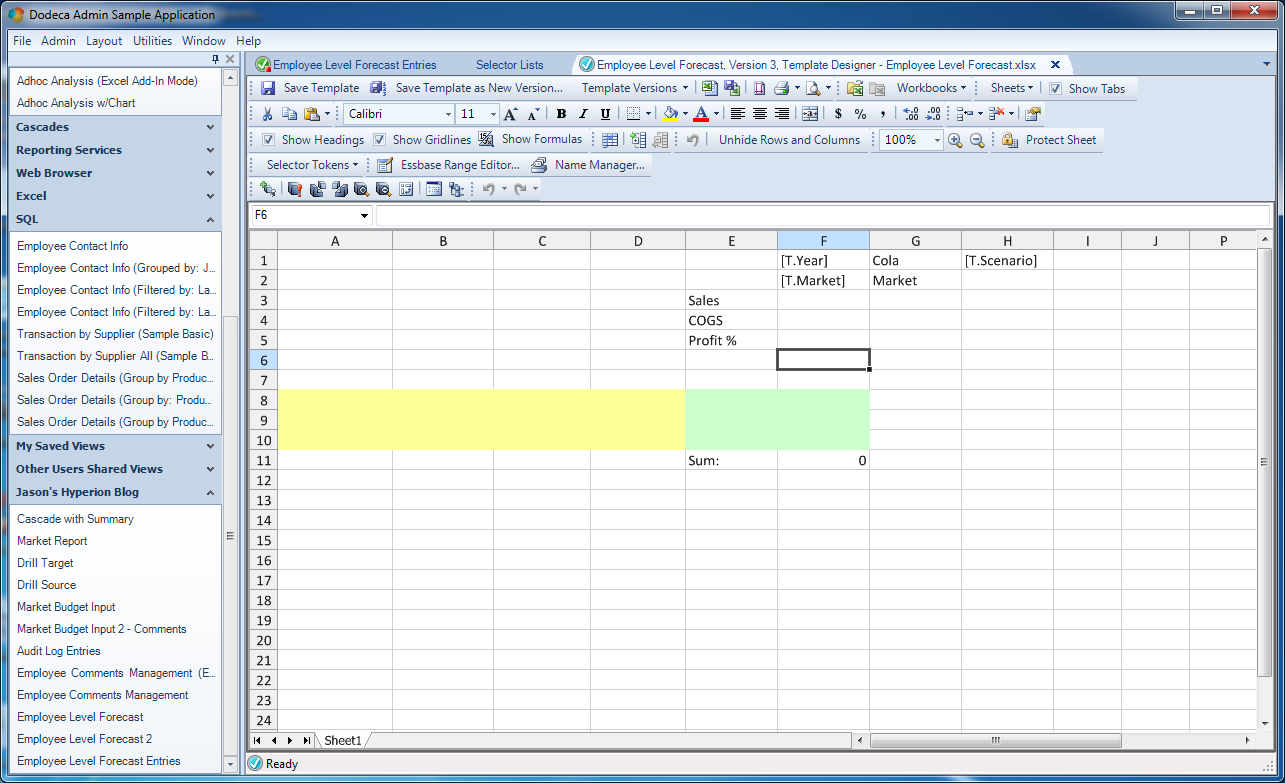
Cleaning up the template

Cleaning up the template

We can also hide those additional columns on the relational data table area, revealing the two things we care about (as a user) – the employee and the sales amount (and not the redundant scenario/market/time period info):
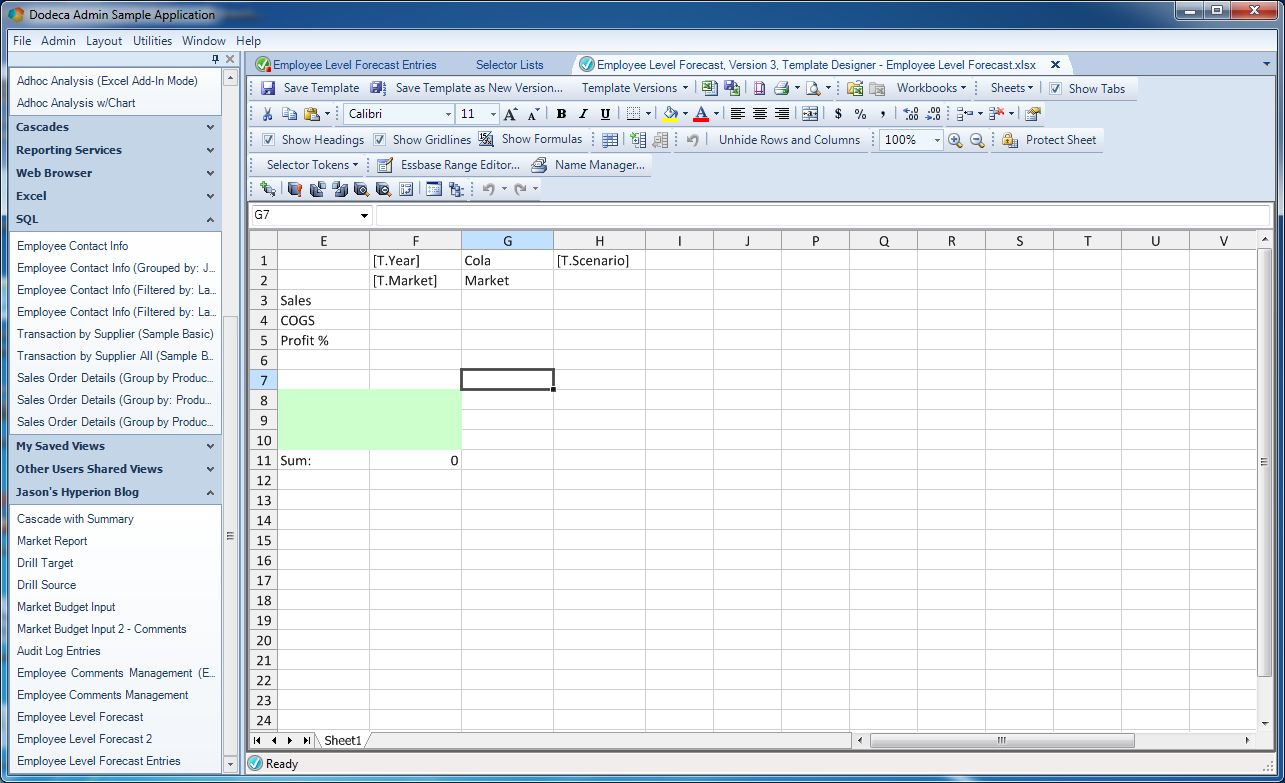
Cleaning up the view template

Cleaning up the view template

Lastly, let’s insert some spacer rows/columns, format some numbers, throw in some shading/borders, hide the Essbase POV little bit (in favor of some dynamic formulas below the header) to really spruce the place up a bit:
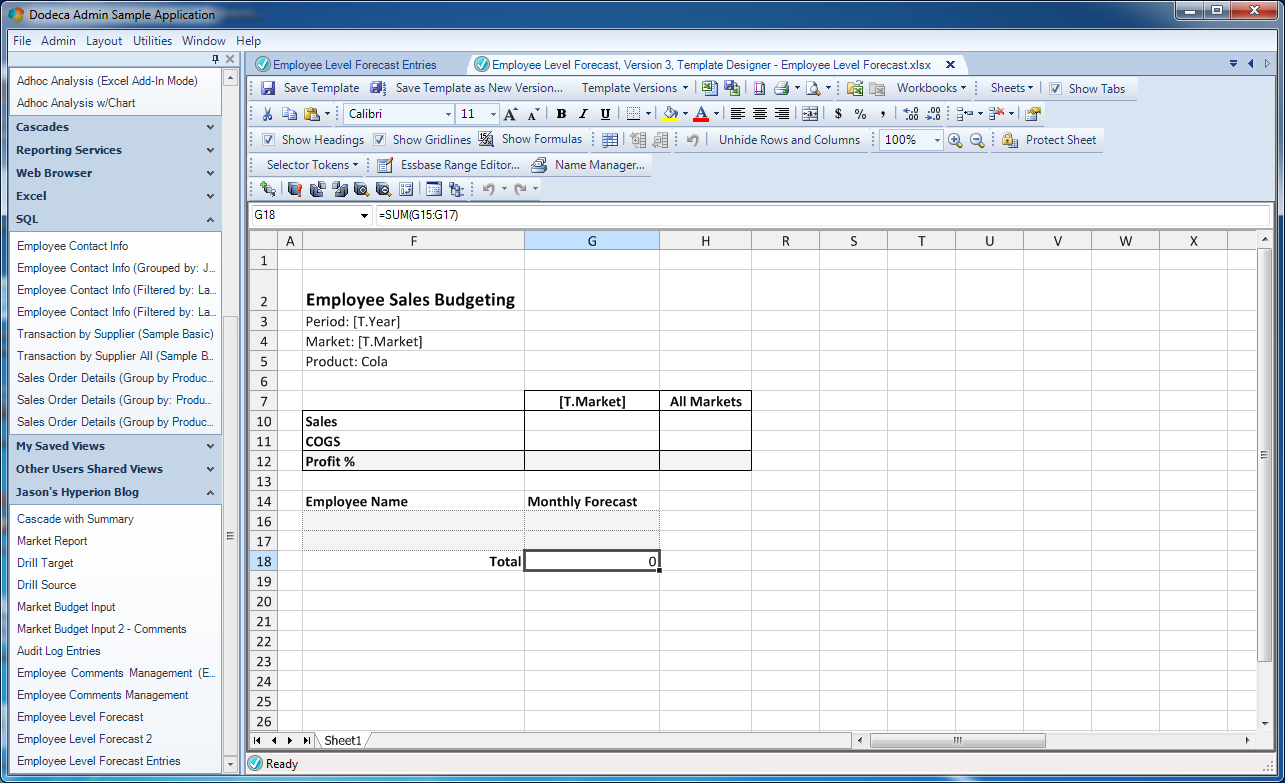
The cleaned up view template

The cleaned up view template

As some additional UI tweaks, I went ahead and turned off the display of tab names at the bottom of the sheet, turned of row and column headers (the grey column/row name boxes), and turned off grid lines. Now when we go build the view, we are presented with a nice clean look:
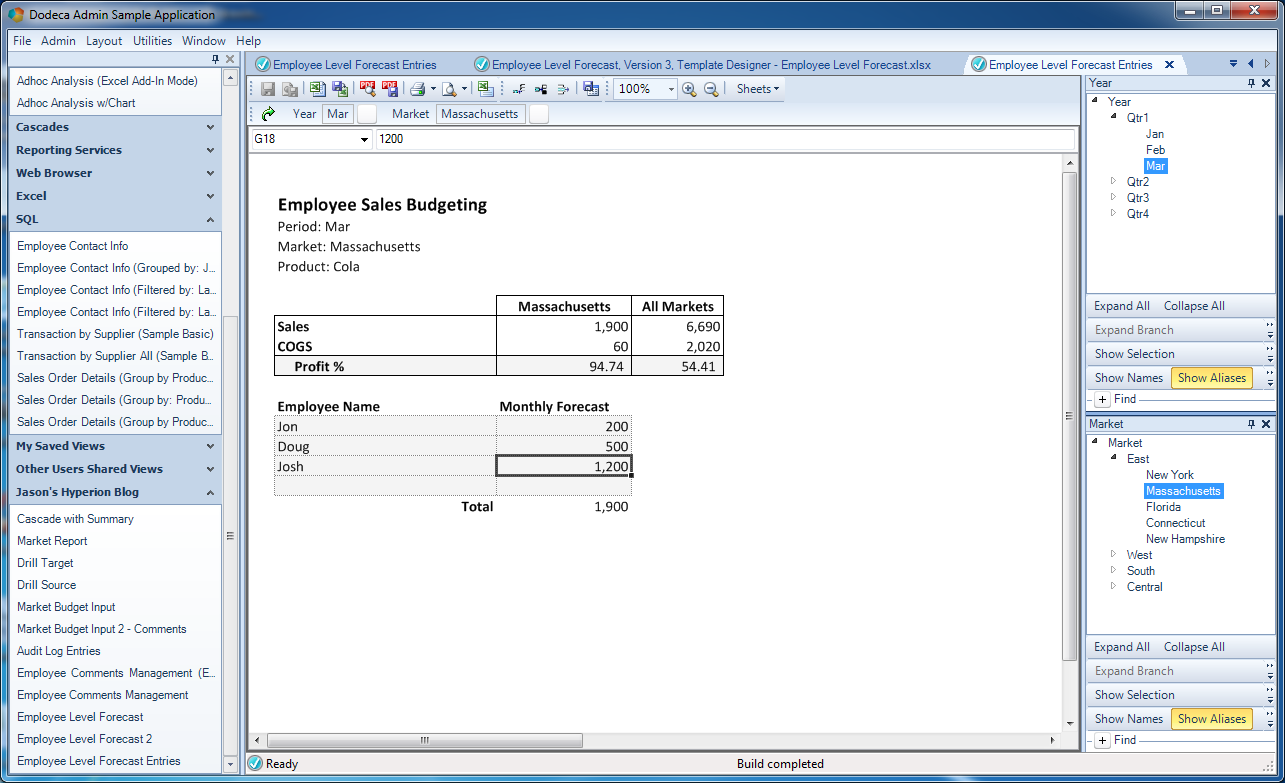
Built view with formatted template

Built view with formatted template

Looking good!

Summary

This was a very long (but hopefully helpful) article. If you only learn one thing from this, let it be the realization that the central spreadsheet paradigm in Dodeca is incredibly flexible, and accommodates an entirely diverse number of requirements. We were able to combine the elements from the previous articles – Essbase data input, SQL data input, focused calcs, and workbook scripts – and tie it all together cohesively in a single, easy to use view. Further, we were able to do it in a way that was built around what we wanted the user experience to be, rather than having to make sacrifices in the user experience due to rigidity in the tool. Mixed together with a little formatting, workbook scripting, and other small tweaks, we were able to build a process that doesn’t allow the user to shoot themselves in the foot, is light years ahead of old school lock and sends, and in this case, we basically implemented our own little Budget Hybrid Analysis using resources we already had. Or as I like to say, Dodeca gives us structure, with flexibility.

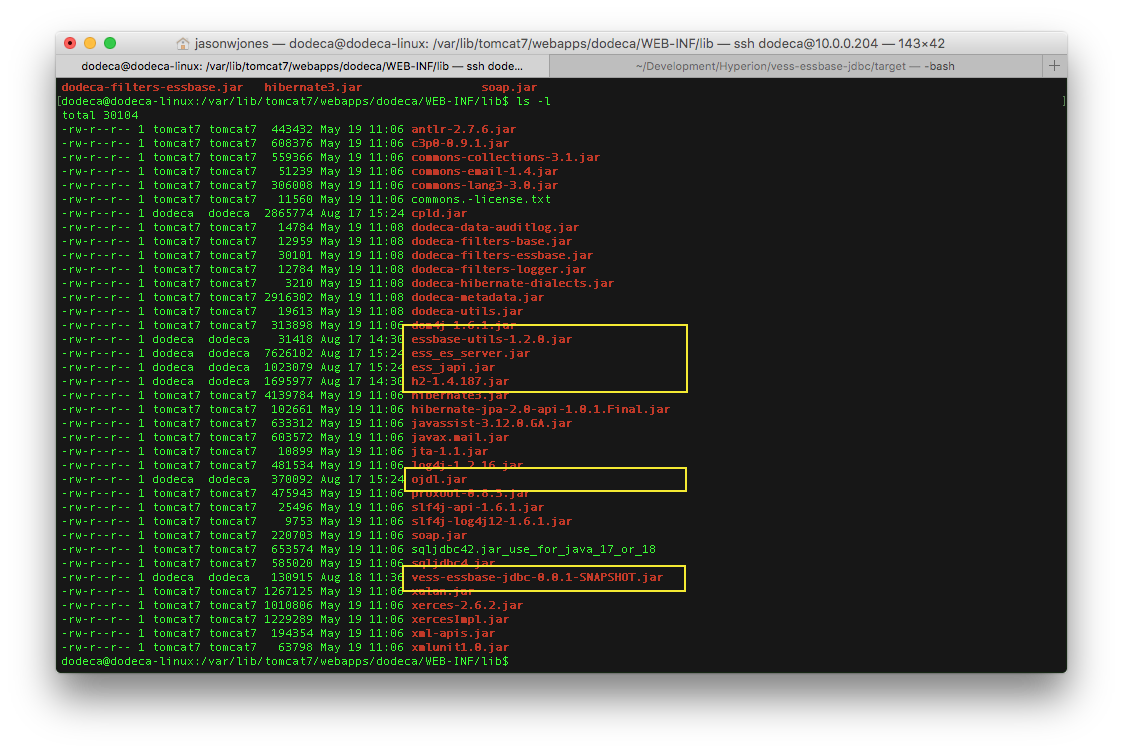
Data Input with Dodeca, part 5 – Relational Database input

I have been really, really looking forward to writing this continuation in the Dodeca Data Input series, for a couple of reasons. For one, it’s a genuinely useful feature that Dodeca implements very well. But secondly, and perhaps more important, the ability to get and store this data from users is just an absolutely missing piece of functionality in the traditional Hyperion toolbox. So this is going to be a bit of a long article but will cover how relational data input in Dodeca works and why it’s so important.

As a quick recap, up to this point I’ve covered basic Essbase data input, cell/variance commentary, going under the hood to look at the audit log tables, and focused calc scripts that run after Essbase input. To this we will now add SQL/relational data input. To put it in context, relational database input is one of the tentpole Dodeca features, and stands next to other heavy hitter features such as Essbase input, comments, drill-through, and cascading reports. Now, all of the individual features of Dodeca are useful and interesting. And yet, I see relational data input as a feature that almost singlehandedly makes Dodeca greater than the sum of its parts.

Relational Data as Part of the Hyperion Toolbox

Before jumping in to the technical implementation of relational data input in Dodeca, I want to wax philosophical a bit on how important I think this feature is. It has the power to be a game changer for a lot of organizations.

My own experience with Hyperion/Essbase is from all angles: as a full-time Hyperion developer for multiple companies, as a consultant with multiple companies, working on dozens projects, and as an independent software vendor with a Hyperion product. Further, my computer science degree minor was in relational database algebra (yes, I’m a nerd). I wrote the innovative Drillbridge software that bridges the gap between Smart View, Planning, and Financial Reporting and relational data. I created an absolutely free version of the Drillbridge software that is fully functional and is downloaded daily and regularly put into production with zero assistance from myself.

So to say that relational data is near and dear or otherwise useful to me is an understatement. As with Dodeca’s robust and battle-tested middle tier component (the secret sauce/glue between the Dodeca client application and all Essbase/relational database servers), Drillbridge is written in 100% Java and contains a web interface for managing its configuration.

All that background is basically my long-winded way of saying that I’ve worked with Hyperion a lot, and if anyone should be qualified to find a way to get user input into a relational database, it’s the guy that programs in Java, writes CDFs for fun, and has created systems that literally take input from a user and put it into a relational database.

And yet, even with all of this experience, getting relational data from Hyperion users has traditionally been this absolute missing link. The situation with pure Essbase data has been a little better: you had lock and send or submit data with the classic add-in/Smart View. Of course, lock and send is not without it’s issues. It’s more of a power user thing, although as I’ve explored in the past, Dodeca can quite nicely provide some structure to the Essbase input process that makes things much more user friendly.

Essbase Relational Data Input Anti-Patterns

I seem to harp on this notion of anti-patterns a bit. An anti-pattern occurs when something is ostensibly designed incorrectly. This happens a lot in the Hyperion consulting world, for instance. A client might be having an issue with their system or performance, and they come to a consultant looking for assistance on that one particular symptom. Unfortunately, all too often, the performance or technical problem is essentially predicated upon a series of unfortunate business, technical, and design decisions (usually ones that can’t be easily/cheaply rectified). Or the company has otherwise accumulated a lot of technical debt – where band-aids have been put on a system in order to keep it hobbling along, without addressing the underlying design problem.

Armed with only Smart View or the classic add-in, but needing to get relational input from users, an intrepid (or masochistic) Hyperion developer might choose a few different routes to try and satisfy this, all of which are less than ideal for various reasons;

  • Dummy members/dimensionality for pseudo relational input
  • Text measures
  • Enter supporting details/data to Excel spreadsheet, and email to admin or store on share folder/drive
  • Custom VBA program/functionality to upload supplemental detail
  • Custom software/web service for user to input data

All of these approaches have issues. Adding dummy members or attributes to a cube is less than ideal and “pollutes” the cube. Some additional functionality might be needed to pull that data out of the cube and marshall into a relational database. Sending emails and saving spreadsheets off to the local share drive is a disaster waiting to happen. I’ve railed on VBA solutions before. They are a mixed bag. Speaking as a consultant, they all too often turn into spaghetti code maintenance nightmares, fraught with glitches, security issues, and more. Lastly, a custom web service or software package might fit the bill, but it takes time and money.

Dodeca Does It (#dodecadoesit)

Let’s explore some what-ifs:

  • What if users could input data using the same interface they are using for reporting and analysis
  • What if we didn’t need to make a single change to our cube dimensionality and cube get relational input from the user
  • What if it didn’t require any custom programming, save for the SQL statements themselves
  • What if we could work with almost any major relational database technology on the planet
  • What if this functionality was a first-class citizen in our software and worked out of the box?
  • What if we could format the data to our heart’s content using a spreadsheet model that we already work with day in and day out?

Here’s the thing: Essbase ostensibly started its life not really caring at all about SQL/relational data. As has been wistfully recalled time and again, Essbase was the secret weapon sitting under your desk. The classic Excel add-in could magically slice and dice data. Over the years, Essbase – and users, whether they realized it or not – grew to have an increasingly important relationship with relational data.

Even the most experienced of Hyperion developers is often at a loss when it comes to providing their users a cohesive solution that can seamlessly work with relational and multi-dimensional data (or OLTP/OLAP if you prefer). And yet, this is a bread and butter feature of Dodeca. It feels almost hyperbolic to say, but I just can’t stress this enough.

Okay, enough with the abstract and architectural. Now let’s move on an actual implementation inside of Dodeca that writes back to a SQL table of our choosing.

Implementing Relational Data Input With Dodeca

For the remainder of this exercise, we’re going to work with a table called EMPLOYEES. It’s a very simple table that contains a employee ID, first name, last name, and a comment about a given employee. The employee ID must be unique (it’s the primary key). The other fields are just made of text. Thy MySQL table definition would look like this:


CREATE TABLE `EMPLOYEES` (
    `EMPLOYEE_ID` int(11) NOT NULL AUTO_INCREMENT,
    `FIRST_NAME` varchar(25) NOT NULL,
    `LAST_NAME` varchar(25) NOT NULL,
    `COMMENTS` varchar(255) DEFAULT NULL,
    PRIMARY KEY (`EMPLOYEE_ID`)
)

Also note that the EMPLOYEE_ID field is an AUTO_INCREMENT value. This is MySQL’s equivalent of a SQL Server identity column, or using a sequence in an Oracle table to generate the next unique value. Essentially what this means is that the database engine itself will take care of creating new values for us, so we don’t (in fact, we don’t want to) insert them manually or ourselves. However, we will be interested in the value that the database engine assigns to the rows we insert. You’ll see later how this is accomplished.

I went ahead and put in a couple of rows using a generic database tool and built a very simple Dodeca view that pulls back the data. Here’s a preview of that:

A basic Dodeca view with relational data

A basic Dodeca view with relational data

One of the blog posts leading up to this one was a quick crash course in how to put relational data into a Dodeca view, so if you’re fuzzy on that, then I suggest you take a look at that. But in a nutshell, here’s what is going on with respect to the template:

Basic template for relational view

Basic template for relational view

Things to note:

  • The range that will be populated with data from the relational query is named EmployeeComments and contains four columns (one for each column we retrieve with the query)
  • I turned on the option to return the headers from the query; those will be populated into the first row of the range. This can be turned off and custom headers can be supplied, but in this case I want to just use them
  • I’ve applied some light formatting to spruce things up a bit: row 2 (the first row of the range) is grey with white text, and I added a spacer row/column to offset the table a little bit. I’m going to set the options on this view to not show row/column headers or the different tabs (again, just settings that I can easily update)

Note the Grid Properties settings that I’ve updated for the view, in order to enhance the visual appearance of the rendered view for the user. In particular, I’ve turned off grid lines (GridLinesVisible = False), headers for the cells won’t be displayed (RowAndColumnHeadersVisible = False), and tab names won’t be displayed (TabsVisible = False).

Updated Grid Properties for relational Dodeca view

Updated Grid Properties for relational Dodeca view

Next we need to use the DataTable Range Editor to tell Dodeca a little about how the SQL Passthrough DataSet we defined earlier is rendered into the named range on our sheet. In the previous post looking at this functionality, we got to leave many of the configuration values as their defaults. This time we need to set a few more things in order to allow user input in addition to viewing the data.

DataTable Range Editor associated with the SQL passthrough dataset on our view

DataTable Range Editor associated with the SQL passthrough dataset on our view

Of particular note in this editor:

  • The DataSheetRangeName is set to the named range from our Excel template (EmployeeComments)
  • The SetDataFlags configuration value includes a value of InsertCells (note that the SetDataFlags parameter can accept multiple values; in this case we are setting just one of of them).

Now let’s cut over to the Query Editor associated with our SQL Passthrough DataSet and take a look at the configuration there:

Query Editor editing the SQL passthrough dataset for employees

Query Editor editing the SQL passthrough dataset for employees

Now, it looks like there is a lot going on here but it’s not too bad. Let’s walk through all of the things that are set in this query. Also remember that the this query configuration is associated with the SQL Passthrough DataSet itself. In other worse, this is the type of logic that we only need to configure in one place and we can then reuse across multiple views if we want (as opposed to having to reinvent this configuration/logic for each individual view).

The important aspects of this query configuration are the SQLConnectionID, DataTableInfo/Columns, and the values in the SQL configuration (InsertSQL, SelectSQL, and UpdateSQL):

  • SQLConnectionID: this is the simplest item to configure. We simply use a dropdown box to choose from our list of SQL connections that have been mapped in previously. We set this regardless of writing data back to SQL or not (we need to set it even if we’re just reading data from SQL, obviously)
  • DataTableInfo/Columns: often these don’t even need to be set because Dodeca can figure them out dynamically. It depends on the JDBC driver in play. I went ahead and created mappings for the columns just to make sure that there would be no issues with reading the column names and types out. The editor for creating these is straightforward and is purely just a literal column name and a column type (int, varchar, datetime, etc.). Additionally, I also explicitly told Dodeca what the primary key for the table is (EMPLOYEE_ID).
  • The SelectSQL configuration is the exact same as before (when we we’re just reading data out of SQL), so nothing new to see there. What’s new is the configuration for the InsertSQL statement.

Let’s take a closer look at the exact configuration of the InsertSQL parameter, as it’s possibly one of the more interesting nuances in this whole configuration. The InsertSQL setting is ostensibly just the parameterized SQL code to insert a new row into the table, however, in this case we actually have two statements (one per line in the following screenshot):

The InsertSQL value for the employees query on the employee SQL passthrough dataset

The InsertSQL value for the employees query on the employee SQL passthrough dataset

The first statement is the parameterized INSERT. The full statement is INSERT INTO EMPLOYEES (FIRST_NAME, LAST_NAME, COMMENTS) VALUES (@FIRST_NAME, @LAST_NAME, @COMMENTS). I want to draw your attention to the fact that I am explicitly not mentioning the primary key (EMPLOYEE_ID) here. Recall that this is the primary key but also an AUTO_INCREMENT (similar to IDENTITY/sequence in SQL Server/Oracle respectively). I’m basically telling the relational database engine “Hey, I’m going to explicitly give you these three things, but you’re smart enough to figure out how to automatically generate the key for me, so please do that.”

Inside of the VALUES section of our insert statement, you’ll see that we have tokens starting with an @ symbol: @FIRST_NAME, @LAST_NAME, and @COMMENTS. When Dodeca goes to do the insert, it’ll dynamically place the values from the row into these placeholders and then execute the query. So to be clear, these aren’t part of the native SQL syntax. For instance, if I am inserting my own name and comments into the row and then have Dodeca save it, the resulting SQL statement that Dodeca generates and then hands off to the database for processing might look like this:

INSERT INTO EMPLOYEES (FIRST_NAME, LAST_NAME, COMMENTS) VALUES ('Jason', 'Jones', 'Awesome employee')

The next statement, and one that’s incredibly useful to our user experience, is the “post insert SQL” command. The code for this post insert command in this case and for this technology is the following:

SELECT EMPLOYEE_ID, FIRST_NAME, LAST_NAME, COMMENTS FROM EMPLOYEES WHERE EMPLOYEE_ID = LAST_INSERT_ID()

Take special note that there is a semi-colon at the end of the first line that is separating the insert command from our special post-insert command. With respect to the post insert command, there are no special tokens in it, but it is specific to MySQL in this case. In particular, the LAST_INSERT_ID() function is a special function that returns the generated ID for the row that was just inserted in the previous statement. Effectively what I’m telling Dodeca is this: “After you insert the first name, last name, and comments to the relational database table, a primary key will have been generated. Here’s how you can use that generated primary key to fetch all of the details for that row, so that you can populate the key on my spreadsheet.”

Let’s go ahead and take a look at how this looks on the spreadsheet and the user experience. With my view all configured, let’s run it and take a look:

The Insert Row button on the toolbar is enabled when the cursor is inside a value input range

The Insert Row button on the toolbar is enabled when the cursor is inside a value input range

I apparently have two employees in this absolutely fictitious company. As you can see, there’s myself, and then there’s Cameron Lackpour. Apparently Cameron likes CALC ALL;. He also really likes load rules, low block density, and inputting to upper level members. But that’s neither here nor there. Anyway.

You can see in the spreadsheet that my cursor is located within the data table somewhere. Because of this, the Insert Row button is active. Take a look at the button toolbar and about in the middle you can see there are some table row-related icons. The Insert Row button is the third button to the left of the “100%” zoom indicator. I simply click on that to insert a new row to the table:

Finished entering data to be sent to the SQL database, but not saved yet

Finished entering data to be sent to the SQL database, but not saved yet

As you can see, I’ve added a new employee and comment. It’s Tim Tow and he apparently knows a thing or two about Excel. The row has not been sent to the database just yet. I will use the Save button on the toolbar (directly to the left of the 100% zoom indicator) to save this row.

Remember, behind the scenes, Dodeca knows that the value of FIRST_NAME is 'Tim', LAST_NAME is 'Tow', and COMMENTS is 'Excel ninja'. So it takes care of all of the ugly work of turning those raw inputs into a valid SQL query, using the statement we provided, talking to the relational database, getting the result back, and in this case, immediately executing the post-insert SQL statement. Immediately after pressing Save, our sheet looks like this:

New row saved and primary key value is automatically updated

New row saved and primary key value is automatically updated

It’s basically the same, save for one thing: the newly generated primary key for the row we entered has been pulled back (along with the rest of the new row) and dynamically updated into the view – with no refresh needed.

Conclusion

This was a very long article that covered aspects of architecture, Essbase anti-patterns, Cameron Lackpour’s love of load rules, and a real example of using Dodeca to write back to a relational table. There are many more nuances to the SQL data editing/updating that I’ll explore in future posts, such as updating existing rows, deleting rows, data grouping and more. But I wanted to give a practical crash course on the basics of this incredibly useful feature. Relational data input is an incredibly useful and important ability to have in so many organizations, and yet when the need for this type of capability arises on the Hyperion side of things in many organizations, all too often there isn’t a compelling, cohesive, and maintainable way to achieve it – but Dodeca does it.

Data Input with Dodeca, part 4 – Focused Calcs

Today’s article continues my series on data input with Dodeca. This post will be an elaboration on the basic data input to Essbase shown off in part 1. As a quick refresher, part 1 just looked at setting up a view that allows a user to input data to a given Essbase intersection. We made it a little more interesting by allowing the user to choose their Market (from our favorite database in the whole wide world, Sample/Basic). Now we want to take it a step further and run a calc script after the user inputs their data. This is pretty typical requirement because data in the cube often needs to be aggregated after lower level inputs.

Achieving this functionality is pretty straightforward. We also have some interesting possibilities because we aren’t limited to just running a static calc script on the server – we are afforded all of the normal Dodeca token replacement functionality so that we can focus the calc however we want. This can be incredibly advantageous for performance reasons. For example, rather than running a calc that refreshes all of the data across the cube, we can focus it on a particular cost center/region/functional unit based on the current POV. Why recalculate data that doesn’t need to be recalculated? Speed up the calc – speed up the user experience.

Cleaning up Anti-Patterns

This technique also let’s us cleanup an Essbase anti-pattern I have seen time and time again out in the real world. Imagine a company that has several managers that control different markets. For example, there are separate managers for New York, Washington, and California. Up until this point, the company has managed to get away with a process that involves doing a classic Essbase lock and send to the proper market, then choosing a calculation to run. The list of calculations might contain the following:

  • BdNewYrk
  • BdWash
  • BdCalifor

All of these calc scripts contain effectively the same script, differing only by that they FIX on. For example:

FIX ("New York", "Budget")
    CALC DIM ("Measures");
ENDFIX

The “run calc after data send” pattern in Dodeca lets us clean this up and consolidate down to a  single calc that will simply plug in the POV from the user’s current Market selector. Let’s take a look at how to set this all up.

Introduction to Workbook Scripts

I’m going to leverage the exact same view as part 1 of the series, and simply add a Workbook Script to it. I’m going to get much, much deeper into workbook scripts in the future, but think of workbook scripts as the procedural side of Dodeca views. They are like a unique but approachable blend of Access macros and VBA functionality. Any view can have a workbook script attached to it. Inside of the workbook script, we can define sequences of procedures and attach them to particular events that can happen to our view.
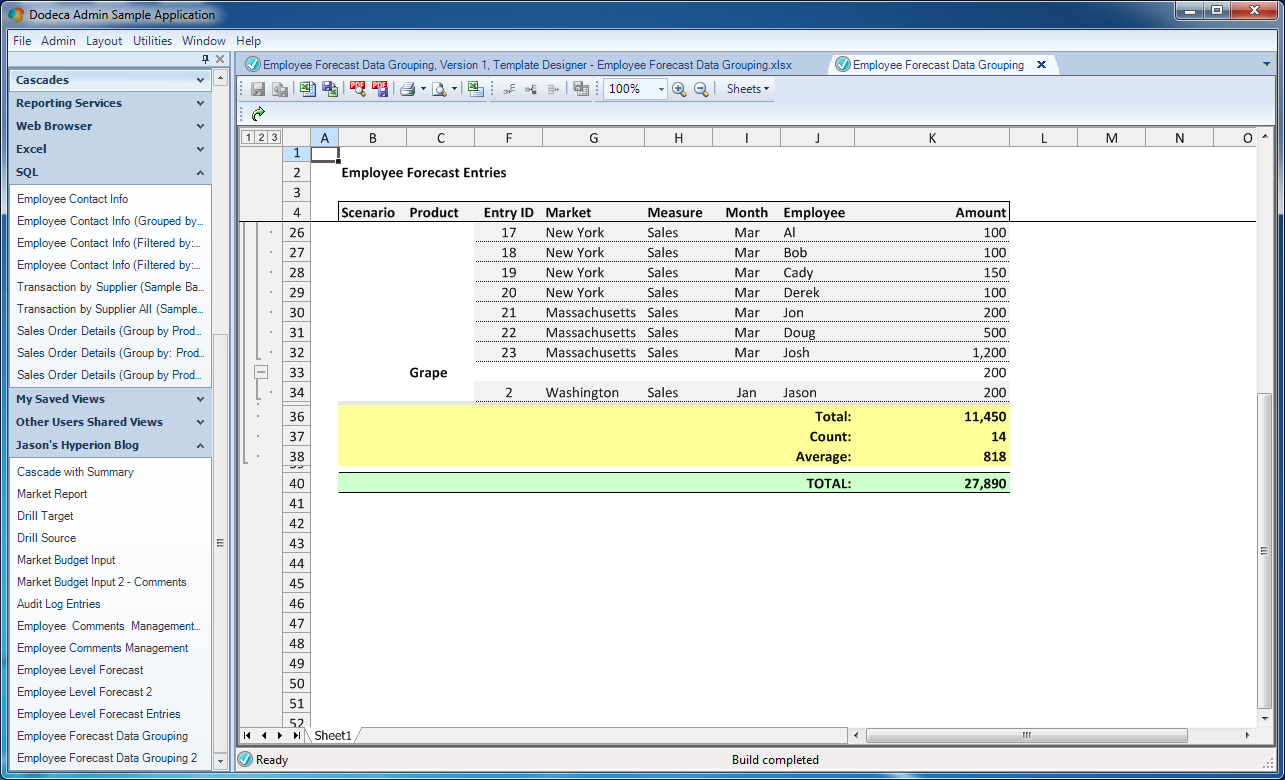
In our case, what we want to have happen is that after the user submits data to Essbase (the AfterSheetSend event), we want to run a procedure that runs a calc script.

Tokenize the Calc Script

The very first thing we need to do is create the calc script that we want to run. This will be a normal server-side calc script, with a twist: replacing the market with a token. Here’s our script:

FIX ("[T.Market]", "Budget")
    CALC DIM ("Measures");
ENDFIX

Note that the market is replaced with a token, just like the tokens that are used on a normal Excel view. Also note that the token is enclosed in double-quotes. Dodeca will perform a full and literal token replacement. So we want to make sure that if the market is New York that it is put inside of the double quotes so we don’t end up with a syntax error. I’ll save the calc as BdMarket.

Create the Workbook Script

Now we head back over to Dodeca and create the workbook script. We can create a workbook script as with any other major object in Dodeca by simply navigating to Admin → Workbook Scripts, then selecting New. Nicely enough, the Workbook Script editor provides a rich environment where we can define most options and items by simply selecting them from a dropdown menu. Consider the following screenshot, showing everything we need:

Dodeca Workbook Script Editor

Dodeca Workbook Script Editor

In particular, see in the Event Links pane that there is a definition that associates the AfterSheetSend event with the CalcMarket procedure. Next, look at the Procedures pane containing all of the procedures in this workbook script. There is just one, the CalcMarket procedure. In the workbook scripting world, there are many, many functions available to us to choose from. In Dodeca parlance, these are known as methods. For many methods within Dodeca, there are multiple versions of it available, these are known as  Overloads. These terms are borrowed from the world of object-oriented programming. Think of the overloads as slightly different versions of a methods but with the same name.

In this current case, the method I’m using is the EssbaseRunCalc method. This particular method has several overloads available. These are General, TextBased, ServerBased, and DefaultCalc. Most use cases will probably be satisfied with TextBased or ServerBased. In the case of TextBased, we can define the entire calc script locally (inside of this Dodeca procedure) and run it on the server. With ServerBased, it’s a calc script that resides on the server, but we still get to perform token replacement on it.

I think what makes the most sense in this case is that we use a ServerBased calc script and include token replacement within it. Don’t be overwhelmed by the numerous options available to us. We can live with the defaults for just about everything. The only thing important that we need to specify is to tell it the name of the calc script (the ScriptName value), and to make sure that DoTokenReplacement is set to TRUE. These should hopefully be self-explanatory by now, but it’s worth pointing out that if we just wanted to run any given server calc script without worrying about tokens, we could just leave the token replacement value set to false.

With the workbook script created and saved, we now simply need to associate it to the view. This is set in the Workbook Script category:

Assigning a Workbook Script to a View in Dodeca

Assigning a Workbook Script to a View in Dodeca

Lastly, after we change some data in the view and click on the Send button, we can go back out to our Essbase server and see what happened on the cube:

Viewing calc script execution results in EAS

Viewing calc script execution results in EAS

You can see in the log that the current POV was used (New York) to replace into the script text, and the resulting script was executed. We can replace any number of tokens if need be, focusing the calc even more. This can frequently be a win for organizations with a wide/deep outline, and many forecasters that need to see aggregated data – but can’t wait for a more general calc to run. This technique can also frequently significantly streamline the technical side of things (fewer calc scripts) and the user experience (as compared to manual input with Excel spreadsheets). It can also potentially help you clean up your filter/calc security situation, in that you can let the user piggyback off their existing read-level access without having to dole out access to a particular calc script.

A primer on relational data views in Dodeca

I’m going to take a small detour from my series on data input in Dodeca so that I can lay the foundation for the next article. Lately I’ve talked about how we can get user input in Dodeca, how users can add comments to their input in Dodeca, and how we can audit the input data by tapping in to the Dodeca audit log tables. As a small preview of where the data input series is going, in the near future I’m going to look at how we can input data to a relational database from within Dodeca.

Prior to that, of course, I’m going to do a brief introduction to relational data in Dodeca. There are a handful of configuration items that need to occur. There’s a little more to it than just dropping in a SQL SELECT statement, but as you’ll see, there is a lot of power and flexibility that will be available to use with just a few clicks.

Define the SQL Connection

The first thing we need is to tell Dodeca about our SQL connection. This is about as standard as it sounds. It’s worth noting that Dodeca allows for an arbitrary number of SQL connections and supports a wide variety of databases, owing to the fact that the Dodeca middle-tier is written completely in Java. This means that, as with software such as Drillbridge, anything with a JDBC driver is fair game – including Oracle, Microsoft SQL Server, DB2, MySQL, and many others.

As with before in the Dodeca data input series, I am using a MySQL schema, since I like running my development instances son a lean and mean Linux VM:

Viewing SQL connections in Dodeca client

Viewing SQL connections in Dodeca client

Note that SQL connections only need to be setup once and then used over and over again. You don’t need to redefine them every time you have a new view. Most organizations will have anywhere from one to a dozen or so different connections, many times to quite a variety of data sources that they are pulling together.

Create the SQL Passthru DataSet

Given a SQL connection that we want to query, we need to create a SQL Passthru DataSet (SPTDS). Try to think of think of this as a collection of SQL queries defined along with several configuration options. In other words, we’re not just dumping a SELECT statement into our view or system somewhere and ending up with an unmaintainable mess. For this simple example, when I create the SQL Passthrough DataSet, I’m configuring which SQL Connection (defined earlier) to use, and defining one or more queries associated with the data set. Note in this example I just have the one query I care about:

Dodeca SQL Passthrough DataSets editor

Dodeca SQL Passthrough DataSets editor

Add the Query to the DataSet

Now that I have my SQL Passthru DataSet created, I will add a query to it. The following editor is used to do this:

Query Editor window for a SQL Passthrough DataSet query

Query Editor window for a SQL Passthrough DataSet query

The main thing I am doing on this screen, clearly, is defining the query itself, which is accomplished by editing the definition for the SelectSQL property:

Editing actual query text in the query editor

Editing actual query text in the query editor

This query is from my previous post on tapping in to the Dodeca audit log tables. Here’s the query for reference:


SELECT
    AUDITLOG.SERVER,
    AUDITLOG.APPLICATION,
    AUDITLOG.CUBE,
    AUDITLOG.USER_ID,
    AUDITLOG.CREATED_DATE,
    DP.MEMBER,
    DP.ALIAS,
    IFNULL(ITEMS.OLD_VALUE, '#Missing') AS OLD_VALUE,
    ITEMS.NEW_VALUE
FROM
    DATA_AUDIT_LOG_DATAPOINTS DP,
    DATA_AUDIT_LOG_ITEMS ITEMS,
    DATA_AUDIT_LOG AUDITLOG
WHERE
    DP.AUDIT_LOG_ITEM_NUMBER = ITEMS.AUDIT_LOG_ITEM_NUMBER AND
    ITEMS.AUDIT_LOG_RECORD_NUMBER = AUDITLOG.AUDIT_LOG_RECORD_NUMBER;

Also note that there are a handful of configuration options relating to the primary key and columns. For this simple example I’m going to stay away from defining those since I don’t need them. In a future post I will go into what those options are and how they can be useful. The important thing to consider for now is that for the most part, Dodeca chooses sensible defaults for me and I can grab the functionality I need without having to worry about setting a million options first.

Create the View

Now I have my SQL connection, a SQL Passthru DataSet, and a query defined. This effectively takes care of all of the non-view specific functionality that I need. Put another way, nothing I defined so far was specific to the view that I’ll be creating in a moment. The objects created so far are all things that can and likely will be reused on other views, saving myself development effort down the road.

Now I want to create my simple view to show the data that I’ve modeled. For my purposes here, I can create a very simple view. Recall that I’ve created a SQLExcel view as opposed to the views I’ve shown earlier in this series that focused on Essbase (don’t worry, it’s possible to put Essbase and relational data on the same view – stay tuned for a future post on that).

For my SQL Excel view, I’m just going to define labels on my top row, apply some very light formatting (bold text), and then freeze the panes so that when I scroll down, my headers will be retained. I have also defined a named range that is as wide as the number of columns I have and is two rows tall. This named range is important because in a moment I am going to configure the view so that it knows to put the SQL data it retrieves there.

Dodeca SQLView Excel template

Dodeca SQLView Excel template

With the view template saved, I can now go over to the view editor and configure a few things so I can “glue” this view (so to speak) to the SQL data I defined earlier. The main property to consider is this SQLPassthroughDataSet Ranges category, which contains one item, DataSetRanges:

dodeca-relational-data-primer-06-sqlview-properties

Upon editing it, I am presented with the DataSet Range Editor. All I have to do here is define my SQLPassthroughDataSetID to point to the dataset I defined earlier (helpfully, they are presented in a dropdown box so I just select it from a list), and then define a DataTableRange.

Dodeca DataSet Range Editor from Edit View screen

Dodeca DataSet Range Editor from Edit View screen

A Quick Note on Solution Architectures

Before going further, I want to step back for a moment and try to alleviate any qualms you might have in terms of the configuration we’ve done so far. If you’re feeling overwhelmed with all of these objects – SQL connections, SQL passthrough data sets, SQL queries, SQL data ranges – I can understand. You might be thinking “Why can’t I just drop in a SQL query and be done with it?”

Well, for a simple SQL Select example, that might seem simpler. But our solution is going to grow. And before long we’re going to want multiple SQL connections, queries, the ability to update rows, delete rows, sort data, group data, and more. And we’re going to have some absolutely incredibly power and flexibility in our hands – and it’ll be maintainable. We don’t want impenetrable walls of SQL code that breaks all the time, and this way of modeling things with connections/data sets/data ranges has been crafted incredibly carefully to offer performance, maintainability, and flexibility (just trust me).

Create the DataTableRange

In a lot of ways, the DataTableRange is where the magic happens. This is the last item we need to define before we can build our view. I don’t actually have to define much here in order to get things to work. I have to tell it where the data from the SQL query should go (my DataSheetRangeName, which corresponds to the defined name on the spreadsheet template), and a couple of other options. By default, the headers from the SQL query would come back along with the data, but I don’t want or need those in this case, because I put in my own “nice” headers on the template, so I can turn those off. This is the SetDataFlags option of NoColumnHeaders. Easy enough. You know what else I want? How about Filtering options that I know and love from Excel? Let’s turn that on with the click of a button by simply setting AutoFilteringEnabled to True.

Didn’t I just tell you that we would have some absolutely incredible power available to us with just a few clicks? That’s a prime example. No funky SQL code to write, no magic in the spreadsheet – just turn on that option and now I’ve got all of Excel’s powerful filtering abilities on any data set that comes back.

That’s all I want to configure for this data range for now. In total my options look like this:

Dodeca DataTable Range Editor screen

Dodeca DataTable Range Editor screen

Build the View

We made it – we have our SQL connection, data set, and data range definition. Future views that use this data will be able to shortcut and jump right into the view definition since we’ll be able to reuse the objects we setup previously, saving us development effort. Time go go build the view:

A Dodeca SQLExcel view built with data from the internal Dodeca audit log tables

A Dodeca SQLExcel view built with data from the internal Dodeca audit log tables

The data in this view should look familiar from the previous post on playing around with the Dodeca Audit Log. And again, note the filtering boxes in each header row, where I can, say, filter on the Member column in order to see only rows that were modified that involved Cola.


Data Input with Dodeca, part 3 – Data Audit Log

Welcome back to the Data Input with Dodeca blog series! We’ve already covered a good bit of ground already. To start things off, we looked at basic data input to an Essbase cube using Dodeca, then we looked at how to let users provide commentary on their Essbase data input. These are both incredibly useful features, but perhaps more importantly, form the cornerstone of many typical Dodeca applications.

Today I want to dive under the hood a bit and look at the Dodeca data audit log. Whenever data is input by a user, it’s logged. This one of the important legs of the data input stool (in addition to comments) and greatly complements data comments. Whereas data cell commentary might be thought of as being useful in a business context, the data audit log is probably more useful in an IT and SOX context. The rest of this article is going to focus on the technical details of the data audit log, while subsequent posts in this series will take a look at putting a friendlier face on it.

The Dodeca data audit log is comprised of three main tables that reside in the Dodeca repository itself. So there’s no additional setup to worry about – these tables exist out of the box.

Data Audit Log Tables

These tables are DATA_AUDIT_LOG, DATA_AUDIT_LOG_ITEMS, and DATA_AUDIT_LOG_DATAPOINTS.

DATA_AUDIT_LOG

The DATA_AUDIT_LOG table contains records of all the overall data input activities. A single data input operation may affect multiple cells of data; all of the affected cells of that are modified in a particular user action are grouped together. This table contains the audit log number (an integer primary key), the Dodeca tenant, the Essbase server/application/cube, the user, and the date the data was modified.

DATA_AUDIT_LOG_ITEMS

There are one or more audit log items associated to a single audit log. In other words, if the data audit log contains a list of transactions, then the audit log items are the list of cells (however many that my be) that were edited in that transaction. This table contains a unique ID (primary key), an association (foreign key) to the audit log table, the old value of the cell, and the new value of the cell. Note that it doesn’t not contain the members from the dimensions (that’s coming up next).

DATA_AUDIT_LOG_DATAPOINTS

The DATA_AUDIT_LOG_DATAPOINTS table contains the member names of cells that were modified. For example, consider our friend Sample/Basic. A sample intersection that was modified might be Sales, Budget, Jan, 100-10 (Cola), Washington. Each one of these would be represented as a single row in the data points table.

All Together, Now

The fully normalized format for storing modified data points tells us absolutely everything we want and need to know about data that is modified. We know the who (user), what (old value, new value), where (Dodeca app, Essbase app/cube, intersection), and when (created time). As for the why – that’s more of a commentary thing.

Given that we have all of this information, and given that it’s stored in a nice normalized form in a standard SQL database, we can query it and view/answer all manner of questions about the data. This opens up some very cool possibilities:

  • Query the database directly to see what changed, if anything
  • Setup an ETL process (ODI!) to provide a regular report of modified data (extra useful during the forecast cycle)
  • Build a view in Dodeca itself that will allow us to query the modified data using standard Dodeca selectors (coming to a future blog post)

For now, let’s take a look at some example queries to get an idea of what we’re working with. The Dodeca repository that I’m working with the moment will be a MySQL schema. MySQL is one of the many relational database technologies that Dodeca works with. The most common ones are Oracle, Microsoft SQL Server, and DB2. But I like my Dodeca servers on a nice compact Linux server, and MySQL fits the bill quite nicely. I’ve tried to write the SQL in the most generic way possible so that if you want to borrow it for your own repository it shouldn’t need any major modifications.

To start things off, let’s say we just want a list of all of the modified data, by user, by modification time, with all data points (this could potentially bring back a lot of data in a large repository, by the way):


SELECT
    AUDITLOG.SERVER,
    AUDITLOG.APPLICATION,
    AUDITLOG.CUBE,
    AUDITLOG.USER_ID,
    AUDITLOG.CREATED_DATE,
    DATAPOINTS.MEMBER,
    DATAPOINTS.ALIAS,
    IFNULL(ITEMS.OLD_VALUE, '#Missing') AS OLD_VALUE,
    ITEMS.NEW_VALUE
FROM
    DATA_AUDIT_LOG_DATAPOINTS DATAPOINTS,
    DATA_AUDIT_LOG_ITEMS ITEMS,
    DATA_AUDIT_LOG AUDITLOG
WHERE
    DATAPOINTS.AUDIT_LOG_ITEM_NUMBER = ITEMS.AUDIT_LOG_ITEM_NUMBER AND
    ITEMS.AUDIT_LOG_RECORD_NUMBER = AUDITLOG.AUDIT_LOG_RECORD_NUMBER
ORDER BY
    AUDITLOG.CREATED_DATE;

Note a couple of things:

  1. Data is sorted by date, oldest to newest
  2. There’s an inner join between the three tables, you must make sure that all tables are joined together
  3. Data that was or became #Missing will be null in the table. For niceness I have used an IFNULL here to convert it to #Missing. Oracle’s equivalent is NVL. SQL Server uses COALESCE.
  4. This table will contain one row per dimension per modified data point (as opposed to one row per modified cell).

Okay, that’s all well and good. How about we filter things a bit and we only want to see data points that were modified in the last 30 days? Just add a simple predicate:


SELECT
    AUDITLOG.SERVER,
    AUDITLOG.APPLICATION,
    AUDITLOG.CUBE,
    AUDITLOG.USER_ID,
    AUDITLOG.CREATED_DATE,
    DATAPOINTS.MEMBER,
    DATAPOINTS.ALIAS,
    IFNULL(ITEMS.OLD_VALUE, '#Missing') AS OLD_VALUE,
    ITEMS.NEW_VALUE
FROM
    DATA_AUDIT_LOG_DATAPOINTS DATAPOINTS,
    DATA_AUDIT_LOG_ITEMS ITEMS,
    DATA_AUDIT_LOG AUDITLOG
WHERE
    DATAPOINTS.AUDIT_LOG_ITEM_NUMBER = ITEMS.AUDIT_LOG_ITEM_NUMBER AND
    ITEMS.AUDIT_LOG_RECORD_NUMBER = AUDITLOG.AUDIT_LOG_RECORD_NUMBER AND
    AUDITLOG.CREATED_DATE BETWEEN CURDATE() - INTERVAL 30 DAY AND CURDATE()
ORDER BY
    AUDITLOG.CREATED_DATE;

Please note that SQL languages differ wildly on their date math. I think the Oracle analogue here is relatively similar but SQL Server’s is a fair bit different.

Okay, how about if we’re only interested in a particular product being modified? Let’s filter on the member name/alias:


SELECT
    AUDITLOG.SERVER,
    AUDITLOG.APPLICATION,
    AUDITLOG.CUBE,
    AUDITLOG.USER_ID,
    AUDITLOG.CREATED_DATE,
    DATAPOINTS.MEMBER,
    DATAPOINTS.ALIAS,
    IFNULL(ITEMS.OLD_VALUE, '#Missing') AS OLD_VALUE,
    ITEMS.NEW_VALUE
FROM
    DATA_AUDIT_LOG_DATAPOINTS DATAPOINTS,
    DATA_AUDIT_LOG_ITEMS ITEMS,
    DATA_AUDIT_LOG AUDITLOG
WHERE
    DATAPOINTS.AUDIT_LOG_ITEM_NUMBER = ITEMS.AUDIT_LOG_ITEM_NUMBER AND
    ITEMS.AUDIT_LOG_RECORD_NUMBER = AUDITLOG.AUDIT_LOG_RECORD_NUMBER AND
    AUDITLOG.CREATED_DATE BETWEEN CURDATE() - INTERVAL 30 DAY AND CURDATE() AND
    (MEMBER IN ('Cola') OR ALIAS IN ('Cola'))
ORDER BY
    AUDITLOG.CREATED_DATE;

Just to hit this home a bit, here’s a screenshot of the data that comes back for my local server, using one of my favorite SQL tools, RazorSQL:

Sample query on the Dodeca repository data audit log tables

Sample query on the Dodeca repository data audit log tables

As I mentioned earlier, one of the really interesting things we can do with Dodeca is to built a view in Dodeca itself that will allow us to easily filter and see what’s going on with the data, by tapping into Dodeca’s own repository. But in the meantime I hope you found this article helpful and saw some of the possibilities that are afforded to you. Invariably when I discuss this tool with people, there is a conversational progression of yes answers that lead to data audit logging:

Does it handle data input?

Does it handle data input comments?

Is there an audit log showing me which data was modified so that I can make my IT Risk/Compliance/SOX department happy, please say yes, please say yes?

Yes!

Data Input with Dodeca, part 2 – Comments

Yesterday, I kicked off my data input mini-series with Data Input with Dodeca, part 1. I’m going to take that example a small step further and put in comments that a user can edit as they add data input. Yesterday I also mentioned that in terms of data input to Essbase, you have several options, some of which include rolling your own in-house solution, such as with VBA (for the record, I recommend against rolling your own solution). It’s a lot of work.

But maybe you’re thinking: “You know what? Locking and sending isn’t so bad, we have a sheet we use…”. Fair enough. What about comments on the data? This question of comments and commentary comes up again and again – for good reason. It’s incredibly useful in the finance world to provide context to a data point, particularly when that data point appears out of the norm somehow.

Comments are a tentpole feature in Dodeca, and probably one of the biggest features in the product that goes to show its philosophy of being a best of breed tool for planning (with a lowercase P!), reporting, spreadsheets, and the best OLAP engine on the planet. Dodeca has extensive support for allowing commentary on any given cell. Today I’m going to talk about one of the simpler use cases for comments. I’ll do this by extending my example from yesterday so that in addition to allowing the user to input budget values for a given market, the user can now provide comments as well.

Setting up Comments in a View

The first thing we need to do is edit our Excel template to add cells for the comments themselves. You can see this in the following screenshot where I have enhanced the data input view from the previous article:

Dodeca input template comment range

Dodeca input template comment range

Note that I have given the comments range a name, in this case Comments.Range.1. This will come into play in a moment when we configure the comments in the view. The next thing that I need to do is define key/value pairs for each comment. Essentially, the key/value pairs are where we use a particular cell to define a unique string of text that identifies a particular comment. As with so many other things in Dodeca, we define this in the cells/workbook itself. The simplest way to achieve this is with a formula that references cells containing members from the point of view (POV).

Excel formula showing the key/value associations for a comment

Excel formula showing the key/value associations for a comment

Check out the formula for the comment for the Sales item:

="Measure=" & B9 & ";" & "Market=" & C$5 & ";" & "Time=" & C$7 & ";" & "Product=" & C$6

This is just a normal Excel formula. The format that I want to achieve in this case is that I have a semi-colon delimited list of items that in the format Dimension=Member. So for the first cell, the resulting intersection is this:

Measure=Sales;Market=[T.Market];Time=Jan;Product=Cola

Because it’s just a normal Excel formula, when I fill down, the item for Measure will update based on the current row (after Sales will be COGS). Also note that in this case we just see the token [T.Market]. Remember that with Dodeca templates we often need to think a bit temporally, which is to say that we need to keep in mind that when the view is built by Dodeca, the token will be filled in with the user’s current selection for the Market dimension, and thus the formula and in turn the POV for the comment will be updated dynamically. Also note the absolute cell references in my formula. I want to make sure that when I fill down the correct cell references are maintained.

Before moving on, note just one more thing regarding the POV for our comments: we don’t need to match up with the Essbase dimensions. We typically will match up to some extent, but you don’t have to slavishly represent each dimension. For if there is, for example, a dimension that has no bearing on the comments, we don’t need to bother to represent it.

Since the comment key/value range is only meant for Dodeca to be able to determine what intersection the comments belong to, we don’t really want or need to show it to the user, so we simply hide that column on our sheet, giving us the following template:

The comment key/value associations are hidden so that users aren't bothered with it

The comment key/value associations are hidden so that users aren’t bothered with it

Now let’s go over to the view properties and tell Dodeca about the comment range in our view, so that it knows how to update and populate them. Under the options for our view, there is a Comments category with several options. In this simple case, we don’t really need to change any of them, except to go in to the CommentRanges item and define a specific comment range (Dodeca allows multiple comment ranges but for now we are just concerned with our one range).

Comments options in Essbase Excel view

Comments options in Essbase Excel view

Let’s take a look at the configuration needed for the comment range that we have been setting up in the template:

Main comment range configuration for Dodeca input template

Main comment range configuration for Dodeca input template

Dodeca offers an incredible number of variations on the user comment experience and we can control most of that experience. For the moment, only consider the options in bold that I have specifically changed in order to make comments work on this sheet:

  • AllowDeleteString: True. I have specifically told Dodeca that I want to allow users to blank out a comment cell if they so choose, thus erasing the comment
  • InCellDisplayPolicy: MostRecent. Dodeca can track the comments for a given data point over time. In this simple case, I just want to show the most current comment
  • EditPolicy: EditInCell. Dodeca has a more featured comment explorer feature that I will get into in the future. For now we just want to edit the comments themselves in the cell
  • ThreadPolicy: OneCommentOnly. Again, there is quite a bit more enhanced functionality available here but I want to keep it simple
  • Address: Comment.Range.1. This address matches the defined name I have for the comments on the sheet
  • KeyItemsString: =OFFSET(@ACell(), 0, 1). This is probably the “trickiest” element to this entire configuration. In a nutshell, for a given comment range, we need to tell Dodeca about the cells that will contain the comments, and the cells that contain the POV for each comment individually. The formula in this cell represents a combination of an Excel formula along with a special Dodeca function @ACell(). The @ACell function returns the address of the current cell. Using the Excel OFFSET function, we can pass an address and a relative offset. In this case we are saying to offset by zero rows, and offset the column by 1. So this returns the value of the neighbor cell. If for whatever reason our comment POV cells were further to the right (such as one more column over), then I would need to increase this value to match.

Lastly, let’s run the view and see what happens:

The Market Input template as built by the user, with our new comment range

The Market Input template as built by the user, with our new comment range

Now let’s enter some text in to explain the value for Colas:

Entering a comment to a cell

Entering a comment to a cell

Given my input policy, the comment is sent up to the database right away. I can close and open this sheet and the comment will be loaded and shown. I can even develop other views and if I plugin the proper comment POV, I can show the comments on a totally different view. The comments are stored in the Dodeca relational repository (not as LROs or otherwise directly in the cube), which gives us fast access to them (and also explains why we don’t need to map every dimension from the cube if we don’t want to).

I hope this brief introduction to the comments functionality in Dodeca was useful and educational. Invariably when people (such as at the Kscope booth) ask about data input, the next question is whether they can get comments too. And the answer is yes; in fact, Dodeca makes it downright easy.

Data Input with Dodeca, part 1

I’m back from Kscope16 (recap coming soon!) and getting back into the swing of things. Needless to say, Kscope16 was another absolutely amazing conference and my three presentations all went pretty smoothly. While at the conference, I got to speak with a lot people about our products, what they do, and how they work. Along those lines, something that came up over and over again in one way or another was that many organizations are performing data input to Essbase using the classic Lock and Send technique or just using the Submit Data button on their Essbase toolbar.

From a purely technical perspective, this can work just fine. From a business perspective, there are numerous pain points. I’ve seen this play out at companies in a handful of ways:

  1. Users have varying levels of Excel/Essbase skill. They are given pre-formatted Excel files and instructed to follow a very specific sequence to enter data into a sheet, connect to the Essbase server, select a range, press submit (or lock, then send), and perhaps run a calculation
  2. Users are asked to fill in a template and email these to a power user or admin so they can properly load it into Essbase using their own template or process
  3. Many hours are spent writing a mini-program in VBA and handing this file out to the users, wherein they are just asked for their username and password, but the automation otherwise hides all of the gory details of connecting and sending data to Essbase.

All three of these situations are rife with complications and things that can go wrong. Off the top of my head, note the following issues in play here:

  1. Varying/extensive amounts of training are required to get users up to speed on how to use Excel, properly format data, and more
  2. The power user/admin is burdened quarterbacking and marshaling significant amounts of data into the cube. This is often a highly paid individual whose time is better spent on other activities, such as development or system improvement
  3. Resist the urge to spend significant amounts of time developing a custom VBA solution. It will always take longer than you think it will and it can quickly become a maintenance nightmare

That all said, one of Dodeca’s core features is the ability to handle data input from users. It excels at this in much the same way that data retrievals work, meaning that we can create an arbitrary spreadsheet to collect input, define what range(s) should be sent up to the server, using any Essbase connection we want, and then optionally performing some action, such as running a calc. For the rest of this post, I’ll be showing a very simple example of this to give you a feel for how this works.

I’m going to modify the simple template that I used for my blog series a couple of weeks ago. This template is based on the Sample/Basic database. In this example, I’m going to fix (hardcode) the product but allow the user to change the Market. This is a bit of a contrived example (normally we’d want the user to budget for multiple time periods) but it will demonstrate the basic functionality. I’ll expand on more complex examples in the near future.
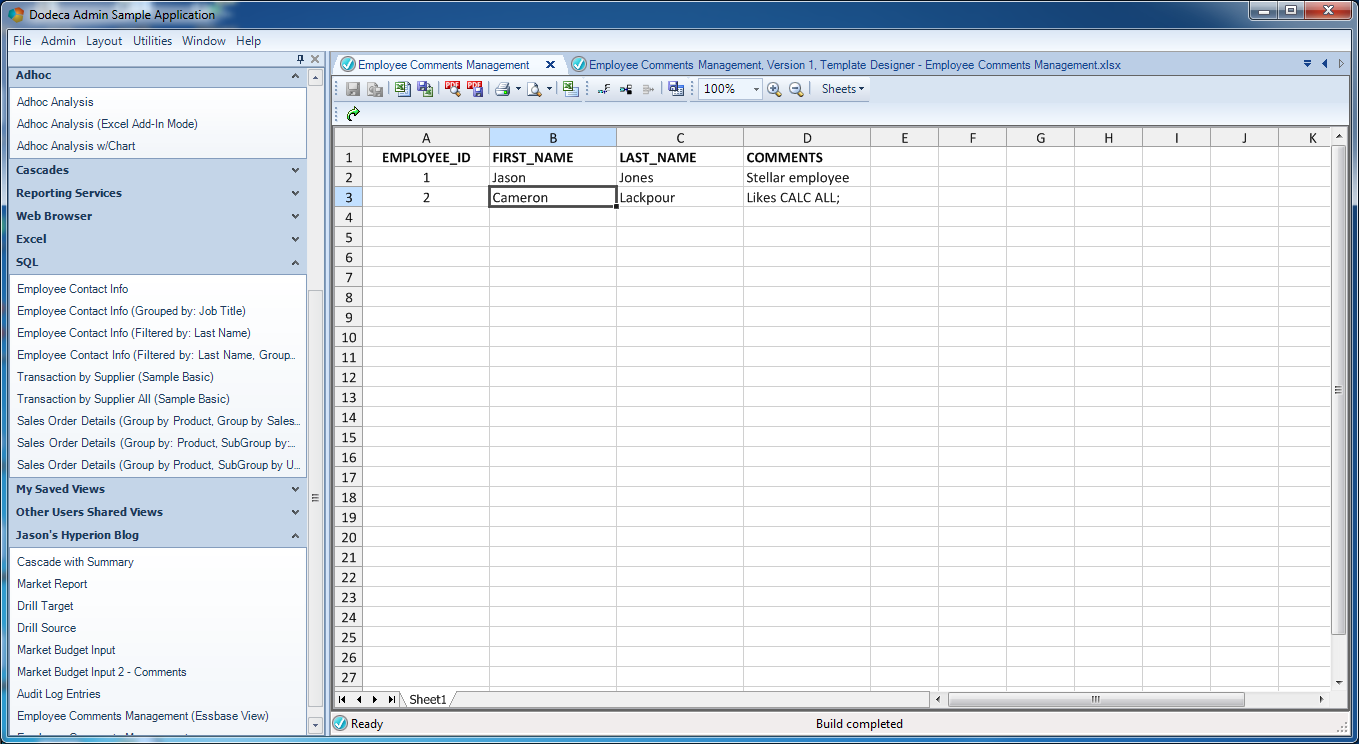
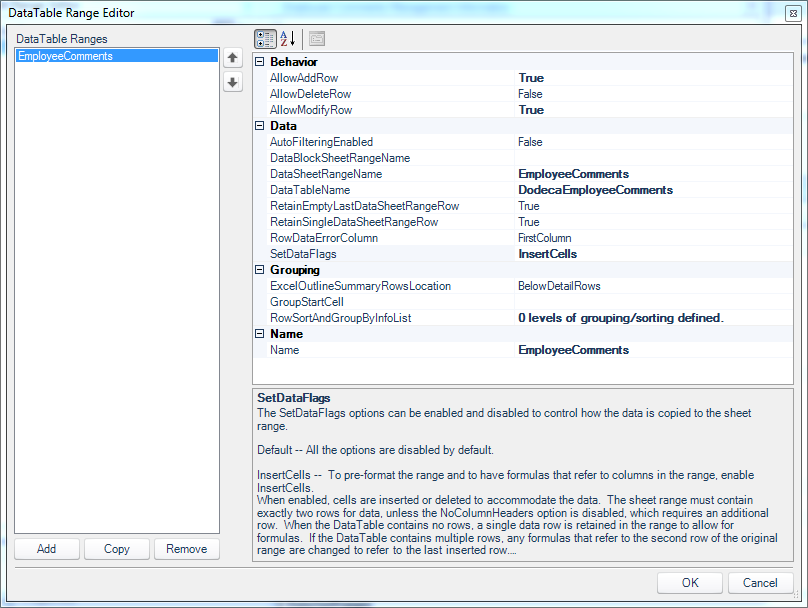
To start things off, let’s take a look at our simple input template:

A simple Dodeca data input view template

A simple Dodeca data input view template

In particular, note that I have used a normal selector [T.Market] to indicate that the market selected by the user should be plugged into the template. So you can think of data input in Dodeca as an elaboration on the normal Dodeca report/retrieve paradigm: we get to use the same spreadsheet/token/selector functionality as before, and simply extend it to send data back up.

In this particular example just to simplify things a bit, I have chosen to hardcode the product (Cola) and the time period (Jan). In a future example I will make those into tokens. As with before, I have decided that for visual/aesthetic reasons, I would like to take the current product and time period and use those values to put a “nice” title elsewhere in the sheet. This is accomplished with a simple Excel formula to concatenate the values using cell references, as shown here:

Dynamic template title using Excel formula

Dynamic template title using Excel formula

Now, one interesting difference in our input sheet versus our normal report sheet is that we are going to use an Excel formula to calculate data as it’s entered and provide the user some instant feedback on the values they are entering. Consider the following example, noting the formulas for Margin, Total Expenses, and Profit:

Regular Excel formulas dynamically calculate user-input as it is entered

Regular Excel formulas dynamically calculate user-input as it is entered

If we were just creating a normal report of this data (meaning it was a retrieval, not a send), we probably wouldn’t have these formulas here, because the data would be coming directly out of Essbase. In the case of input, however, there is no harm in putting a formula here, and indeed, that’s exactly what we want. Remember, we get to leverage all of the power and expressiveness of Excel in our templates, so we can include just a normal Excel formula in these rollup rows (since the user won’t be entering a value for them anyway), and as the user enters data we can show them the dynamic total. This is a somewhat subtle nicety that I think is worth noting. Among other things, it obviates the need for the user to, say, enter a value, submit it, calculate the cube, retrieve, and see what their running total is. Again, remember, we are looking for that polished and intuitive user experience.

Given the way this template is constructed, we need to let Dodeca know what the range of cells is that contains data to be sent to the cube. This works exactly the same as it does for retrieval ranges, just with a slightly different name. Shown in the following screenshot is the special named range Ess.Send.Range.1 that let’s Dodeca know (in conjunction with our SendPolicy) where the Essbase data range is that should be sent to the cube.

With the template and view saved, I can now run it:

Our built input view showing current values for the Budget for this POV

Our built input view showing current values for the Budget for this POV

Let’s see what happens when I type in a value for Marketing and hit enter:

Dodeca input view, shown with rest of Dodeca client for context

Dodeca input view, shown with rest of Dodeca client for context

My Expenses value was dynamically updated via its Excel formula, and in turn, my profit value was updated.

Do you see the problem with this data? If you said, “Wait a second, you just increased your expenses but the profit went up, what gives?” – you’d be correct (and astute).

We aren’t limited to just addition or simple sums – again, we can use just about any Excel function that we want. In this case, a better formula to use would be one that subtracts the expenses from the margin and shows the value. I simply go back into my Excel view template, update the formula in cell C16 to actually be =C11-C15, save the template, and re-run it.

Now check out my dynamic totals:

Budget input example with dynamic formula values

Structure with Flexibility

I hope you enjoyed this simple example of user input directly to Essbase that is facilitated by Dodeca. In the coming weeks I’m going to show off some really interesting examples that are more involved, but I definitely wanted to start off with the basics. I think this is incredibly relevant due to the apparently huge number of people I have talked to (especially last week at Kscope) that have a very cumbersome input process fraught with Excel sheets flying back and forth via email, extensive user training, and sometimes performance issues. Even if I was the manager of a relatively small finance team (especially if including non-finance users), I would be looking for a tool that provided me enough structure to make the process streamlined and straightforward, while maintaining flexibility: adapting a process to my business rather than adapting my business to a process (or technology). In this regard, Dodeca delivers.